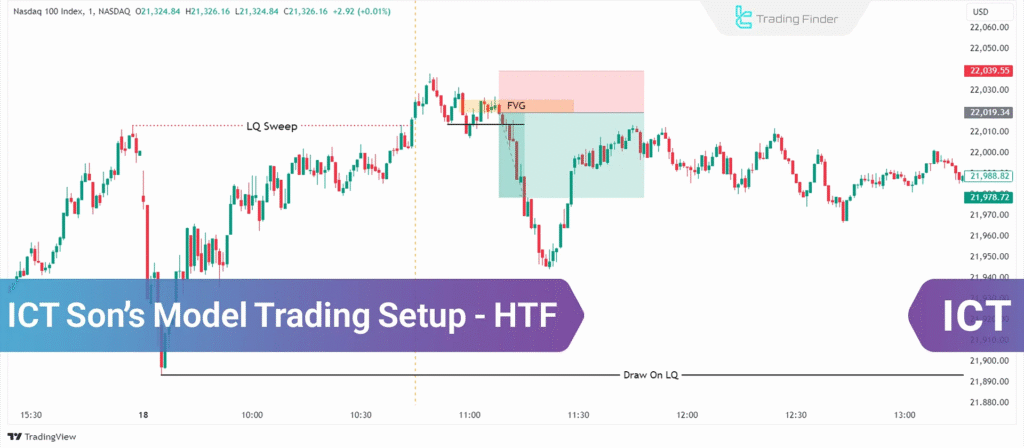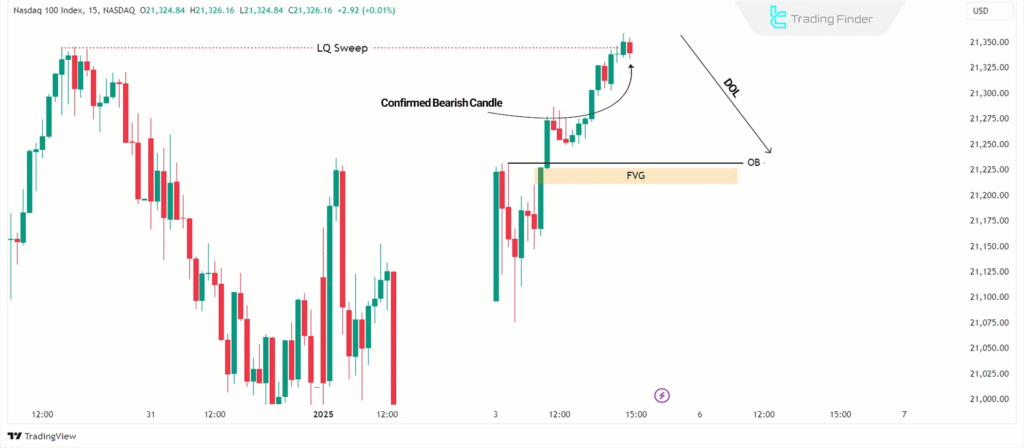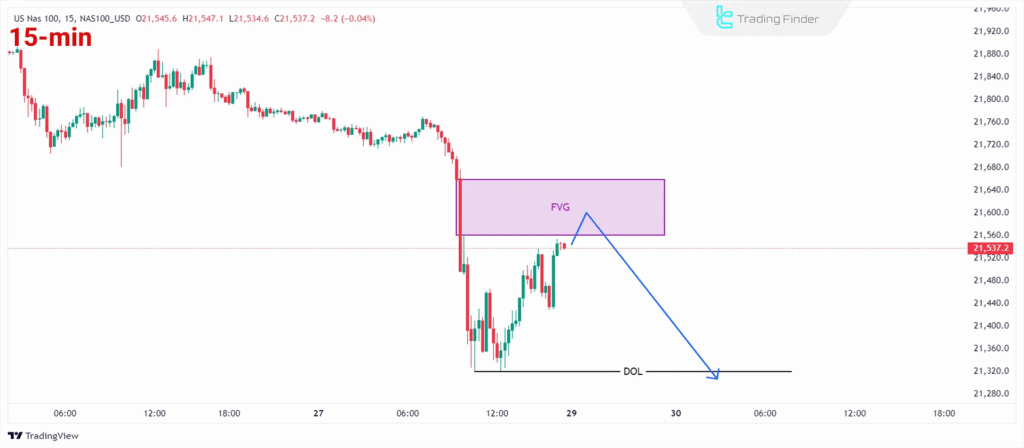
The Son’s Model is a price action trading setup taught by ICT (Inner Circle Trader).
It is often called the 30-Second Setup because traders look for the entry confirmation on the 30-second chart after price creates liquidity grabs on higher timeframes.
This setup focuses on trading around liquidity pools – areas where traders’ stop losses are placed.
Institutions or “smart money” often manipulate price into these areas before reversing.
The Son’s Model helps you identify this move and enter with precision.
1. The Core Idea of the Son’s Model in ICT

The Son’s Model is built around liquidity raids.
Price often sweeps one side of the market (grabbing stop losses) and then reverses to the other side.
It is most effective when:
- The market is already in a clear trend.
- You identify a key level or liquidity pool.
- You wait for price to grab liquidity and then enter on the 30-second chart.
In short: Find liquidity → Wait for a sweep → Enter on lower timeframe confirmation.
2. Step 1: Identify Liquidity on Higher Timeframes as per ICT

Start with the 1-hour or 15-minute chart.
Look for:
- Equal highs (double tops) → liquidity above.
- Equal lows (double bottoms) → liquidity below.
- Previous day’s high or low.
Example: On EURUSD 15-minute chart, you see equal highs around 1.0950.
Many retail traders place stop losses above this level. That’s your liquidity pool.
3. Step 2: Wait for the Liquidity Sweep as per ICT

Now, switch to the 1-minute chart and watch price action around that level.
- If price runs above the equal highs and then rejects → liquidity has been swept.
- If price drops below equal lows and quickly comes back → liquidity has been swept.
Example: EURUSD spikes to 1.0955, taking out all stops above 1.0950, but then immediately drops back under 1.0950.
This is your signal that liquidity has been collected.
4. Step 3: Drop to the 30-Second Chart to find ICT Price Action

Here’s where the Son’s Model gets its name. The 30-second chart gives you precision entries.
On the 30-second chart, look for:
- A Market Structure Shift (price breaking the opposite side).
- A small Fair Value Gap (FVG) or imbalance to use as an entry point.
Example: After the liquidity sweep, on the 30-second chart, EURUSD breaks a minor low and forms a small imbalance.
This is where you prepare to enter.
5. Step 4: The Entry as per ICT Son’s Model

- If liquidity was taken above (bullish stops), you look for a sell entry.
- If liquidity was taken below (bearish stops), you look for a buy entry.
Enter when price retraces into the 30-second Fair Value Gap.
Example: EURUSD retraces into the tiny imbalance after the sweep.
You enter short at 1.0950.
6. Step 5: ICT Stop Loss and Target

The Son’s Model is very precise, so risk is small.
- Stop Loss: Place it above the sweep if selling, or below the sweep if buying.
- Target: Aim for the opposite liquidity pool.
Example:
- Entry: Sell at 1.0950
- Stop Loss: 1.0957 (just above the sweep)
- Target: 1.0920 (previous equal lows)
This gives a high risk-to-reward trade, often 1:5 or more.
7. Example Trade Walkthrough of ICT Son’s Model Trading Strategy

- On the 15-minute chart, you see equal highs at 1.0950.
- Price spikes to 1.0955, sweeping liquidity.
- On the 1-minute chart, price rejects back under 1.0950.
- On the 30-second chart, price shifts structure and leaves a Fair Value Gap.
- You sell at 1.0950, stop loss at 1.0957, target at 1.0920.
This single trade could give you 30 pips with only a 7 pip risk – a strong 1:4 risk-to-reward trade.
8. Why the 30-Second Chart in ICT Son’s Model Trading Strategy?
Most traders only use the 1-minute chart. But the 30-second chart gives even more precise entries with smaller stop losses.
This is why ICT calls it the Son’s Model—it’s a refined and sharp version of his original liquidity concepts.
9. Final Thoughts
The ICT Son’s Model 30-Second Setup is a scalper’s dream strategy.
It combines:
- Higher timeframe liquidity levels.
- Lower timeframe confirmations.
- Ultra-precise entries with small stop losses.
To apply it correctly:
- Mark liquidity pools on higher timeframes.
- Wait for a sweep.
- Drop down to the 30-second chart.
- Enter using structure shift + Fair Value Gap.
Practice this on demo before going live.
Once mastered, it can become one of the most powerful setups in your trading arsenal.

Leave a Reply