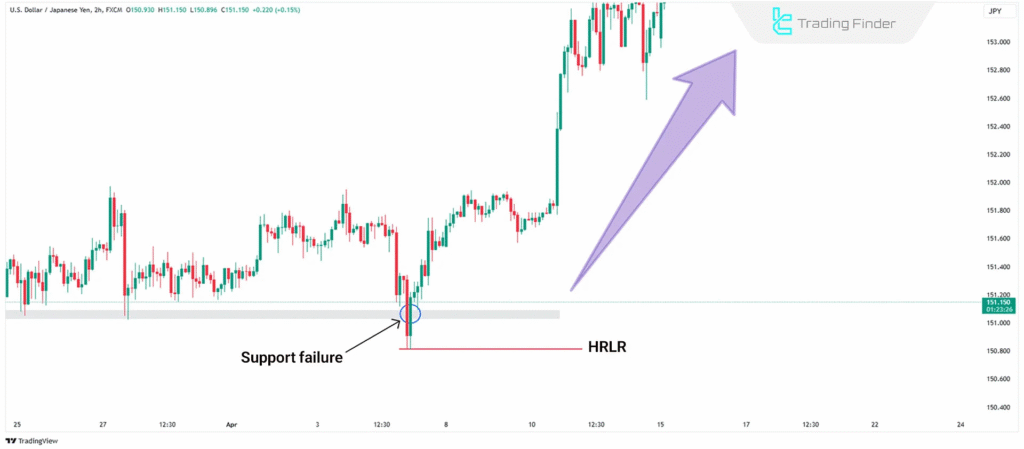
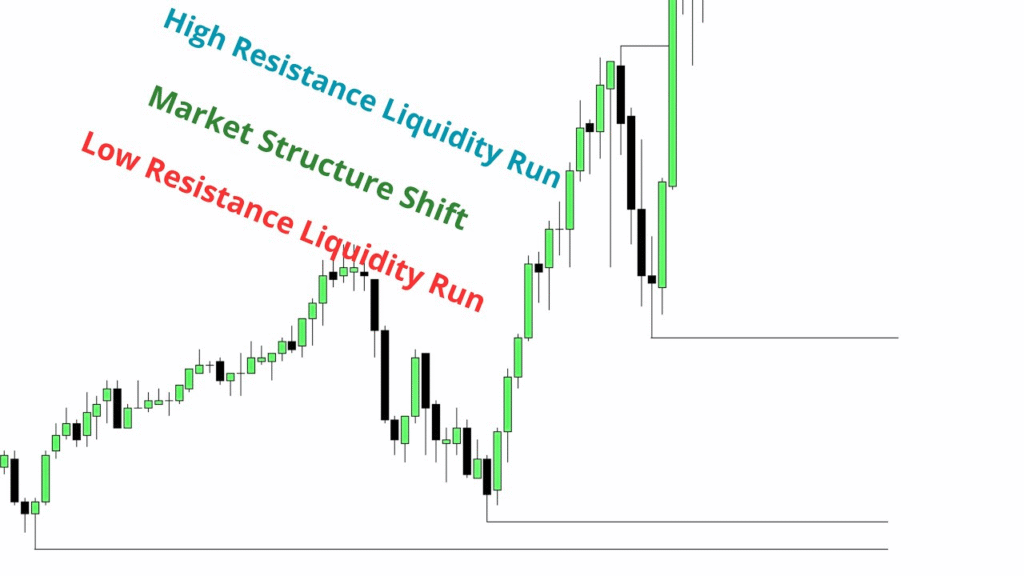
In ICT (Inner Circle Trader) terminology:

These are advanced Smart Money Concepts that explain how price aggressively targets liquidity sitting at obvious highs or lows in the market.
They show how institutions engineer moves to sweep stop-losses and then reverse or continue the trend.
1. What is Liquidity in ICT?
In trading, liquidity means money in the form of stop-losses or pending orders sitting above highs or below lows.
Retail traders often place stops just above swing highs or below swing lows. Smart Money targets these areas for their own entry and exit strategies.
2. HRLR – High Resistance Liquidity Run in ICT

1. What it Means:
A HRLR happens when price runs through multiple recent highs, one after the other, with very little resistance.
These highs represent buy-side liquidity (retail stop-losses and breakout buys).
Smart Money uses this move to:
- Trigger stop-losses above the highs
- Induce breakout traders to buy late
- Then either reverse or continue the move with strong momentum
2. Example: High Resistance Liquidity Run in ICT
Let’s say EUR/USD has the following highs:
- 1.0950 (Monday)
- 1.0960 (Tuesday)
- 1.0970 (Wednesday)
During the New York session, price suddenly pushes up through all three levels in one sharp move — this is a High Resistance Liquidity Run.
After sweeping the liquidity, price might:
- Reverse and drop (liquidity sweep completed)
- Or continue if it’s aligned with a higher-timeframe bullish narrative
3. LRLR – Low Resistance Liquidity Run in ICT

1. What it Means:
A LRLR is the opposite — price runs below multiple recent lows without much reaction.
These lows represent sell-side liquidity — mostly stop-losses from long trades or breakout shorts.
This move is designed to:
- Trap breakout sellers
- Trigger stop-losses
- Grab liquidity before Smart Money shifts direction
2. Example: Low Resistance Liquidity Run in ICT
USD/JPY has lows at:
- 148.50
- 148.30
- 148.10
During London session, price slices through all these levels quickly. That’s a Low Resistance Liquidity Run.
Once the liquidity is cleared, price may:
- Reverse back up strongly
- Or consolidate before making the next move
4. How to Identify HRLR & LRLR in ICT

Watch for:
- A series of equal or stair-stepped highs/lows
- A sudden aggressive move that cuts through these levels
- A possible shift in market structure right after the sweep
You’ll often see these setups near:
- Killzones (London or New York open)
- Major news events
- Order blocks or fair value gaps on higher timeframes
5. Why HRLR & LRLR Matter in ICT

These runs reveal where Smart Money is active.
Understanding them helps you:
- Avoid trading traps
- Spot ideal entry points after liquidity is taken
- Trade with the market’s true intention, not against it
Instead of following breakouts blindly, you wait for liquidity sweeps and then trade the reaction.
6. Final Thoughts
HRLR and LRLR are not just patterns — they’re tactics used by institutions to target retail orders.
Once you learn to spot them, you’ll stop entering too early and start aligning your trades with Smart Money flow.
Would you like a chart example to visualize a real HRLR and LRLR setup in action?

Leave a Reply