
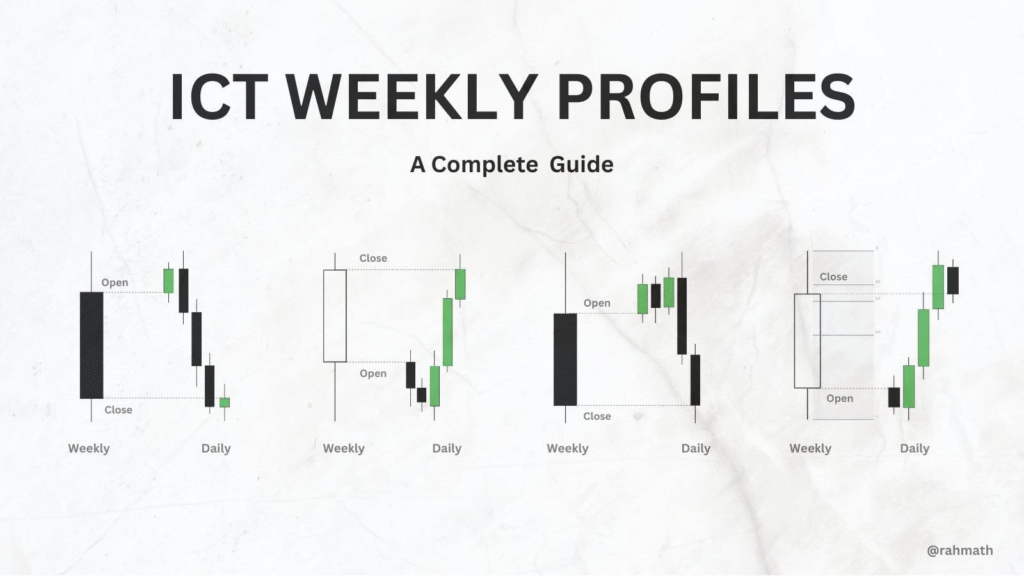
In ICT trading, Weekly Profiles refer to how Smart Money structures price throughout a trading week.
The key idea is:
Each week, there is a defined High and Low — and Smart Money knows exactly where and when to form them.
Your goal as a trader is to identify the High and Low of the Week (HOD/LOW) early enough to trade the main move with the institutions, not against them.
1. Why are ICT Weekly Profiles Important?
Knowing how to recognize the high and low of the week helps you:
- Avoid entering at the worst possible time
- Stay out of false breakouts
- Ride large moves after traps and manipulation
- Improve risk-reward by catching the best entries
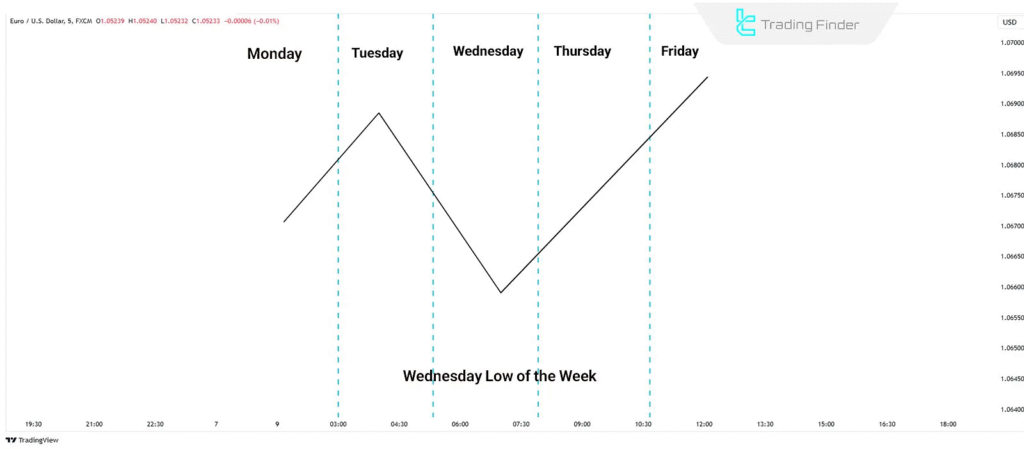
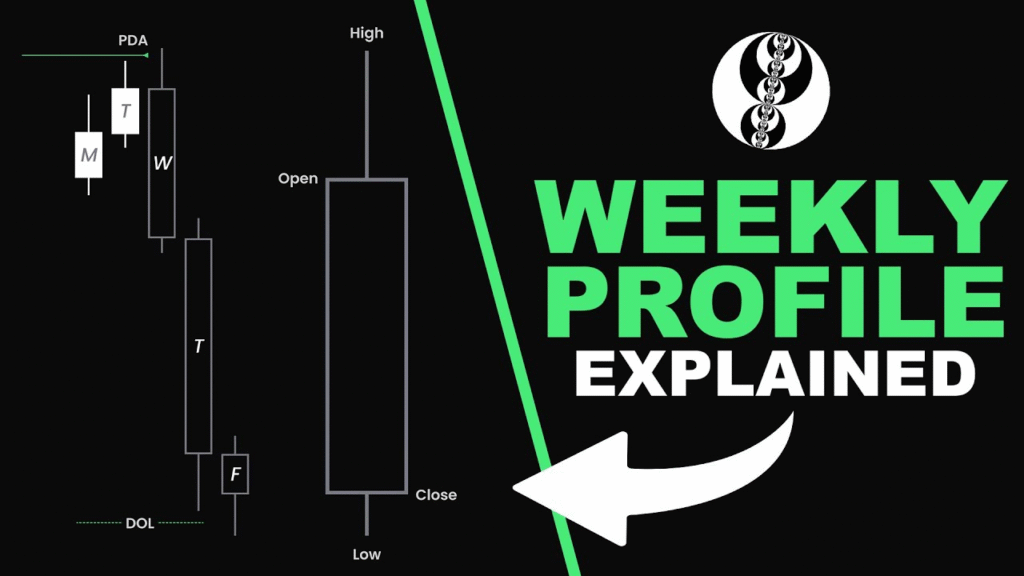
2. Typical Weekly Price Behavior inside ICT Weekly Profiles
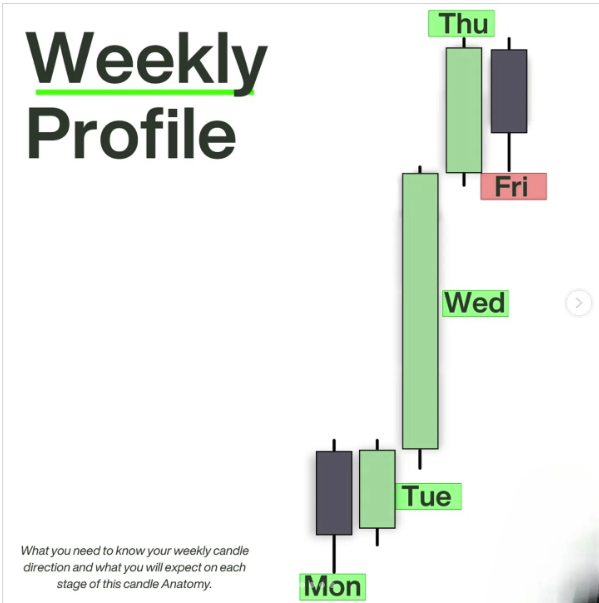
Here’s how price generally behaves in a standard trading week:
- Monday – Accumulation Range
Price often stays within a tight range. - Tuesday/Wednesday – Liquidity Raid & Fake Move
Price takes out stops above Monday high or below Monday low. - Wednesday to Friday – Real Directional Move
Once Smart Money collects liquidity, price expands in the real direction — forming either the high or low of the week.
3. How to Identify the Weekly High or Low
Step 1: Mark the Monday Range
Start by drawing a box from Monday’s High and Low. This acts as a key reference zone for the rest of the week.
Step 2: Wait for Liquidity Raid
Watch for price to:
- Break above Monday’s high (fake bullish move)
- Or break below Monday’s low (fake bearish move)
This is usually a manipulation move to trap retail traders.
Step 3: Confirm the Reversal
Use tools like:
These confirm whether price is rejecting the manipulation and shifting direction.
Step 4: Expect Expansion
Once the reversal is confirmed, price often expands in the opposite direction of the initial fake move — forming the weekly low or high.
4. Example 1 – Bullish Scenario (Low of the Week Set Early)
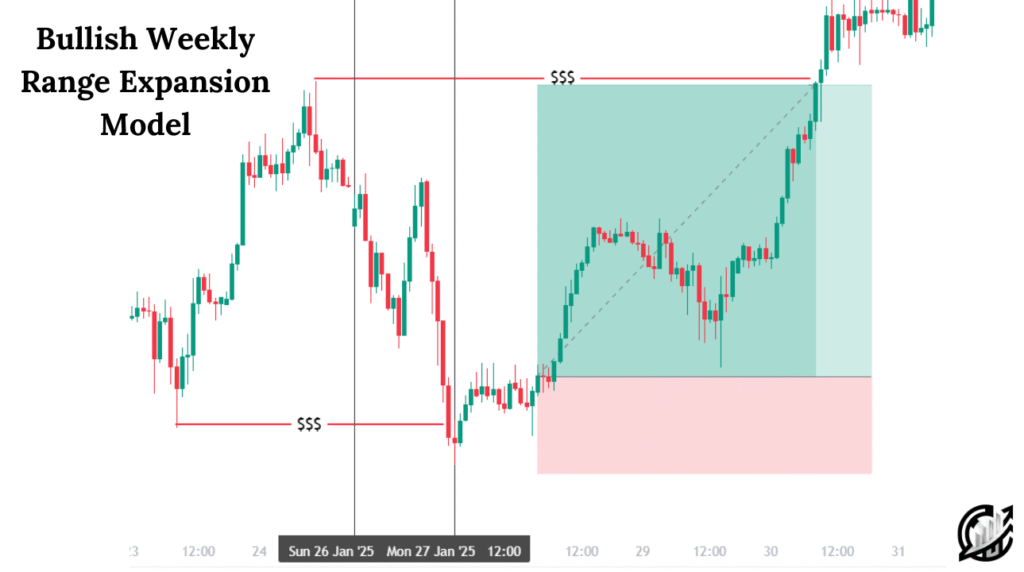
Week: EUR/USD
- Monday: Trades in a 40-pip range between 1.0800–1.0840
- Tuesday: Price breaks down to 1.0780 (below Monday’s low)
- Wednesday: Price forms CHOCH and BOS to the upside
- Thursday-Friday: Strong rally to 1.0950
The low of the week was formed on Tuesday.
Smart Money grabbed liquidity and then moved price up.
5. Example 2 – Bearish Scenario (High of the Week Set Early)
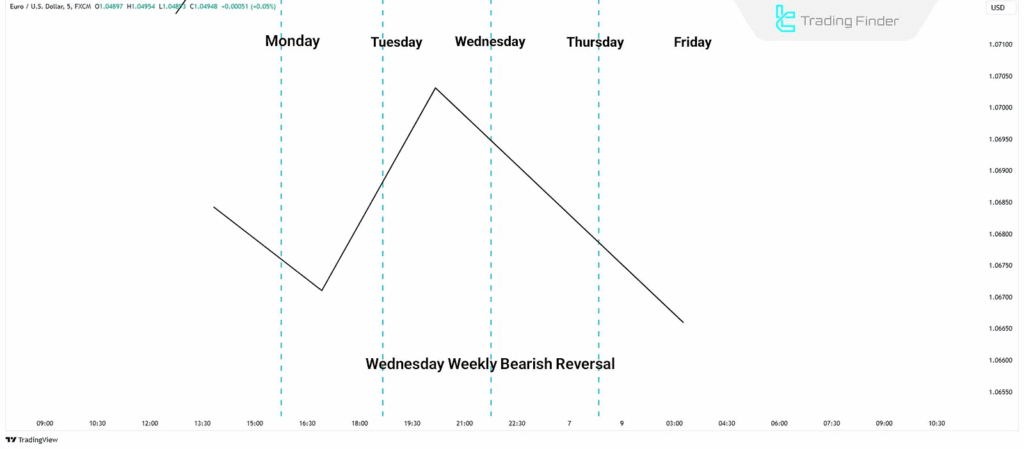
Week: GBP/USD
- Monday: Consolidates between 1.2650–1.2700
- Tuesday: Price spikes to 1.2725 (above Monday’s high)
- Wednesday: Price starts reversing with bearish FVG
- Thursday-Friday: Price drops to 1.2550
The high of the week was made on Tuesday.
The fake bullish breakout led to the real move down.
6. Tips to Master ICT Weekly Profiles
- Don’t trade blindly on Monday — it’s mostly noise and positioning.
- Use Tuesday’s raid as your main signal for direction.
- Combine with Killzones (London Open, NY Open) for timing.
- Look for FVGs, OBs, and CHOCH after the raid to enter confidently.
- Understand that the weekly low or high is often set between Tuesday and Thursday.
7. Final Thoughts
Mastering ICT Weekly Profiles and identifying the High and Low of the Week will dramatically improve your trading accuracy.
You’ll stop chasing false breakouts.
You’ll start trading with confidence, in the same direction as Smart Money.
Would you like a free downloadable weekly profile template to apply this strategy to your charts?
Leave a Reply