
The Pin Bar is a powerful candlestick pattern frequently used in the Inner Circle Trader (ICT) framework.
It indicates a potential reversal or continuation of the price trend, providing traders with a strategic entry point.
In ICT, the pin bar becomes even more effective when combined with key concepts such as order blocks, liquidity pools, and fair value gaps (FVGs).
1. What is a Pin Bar?
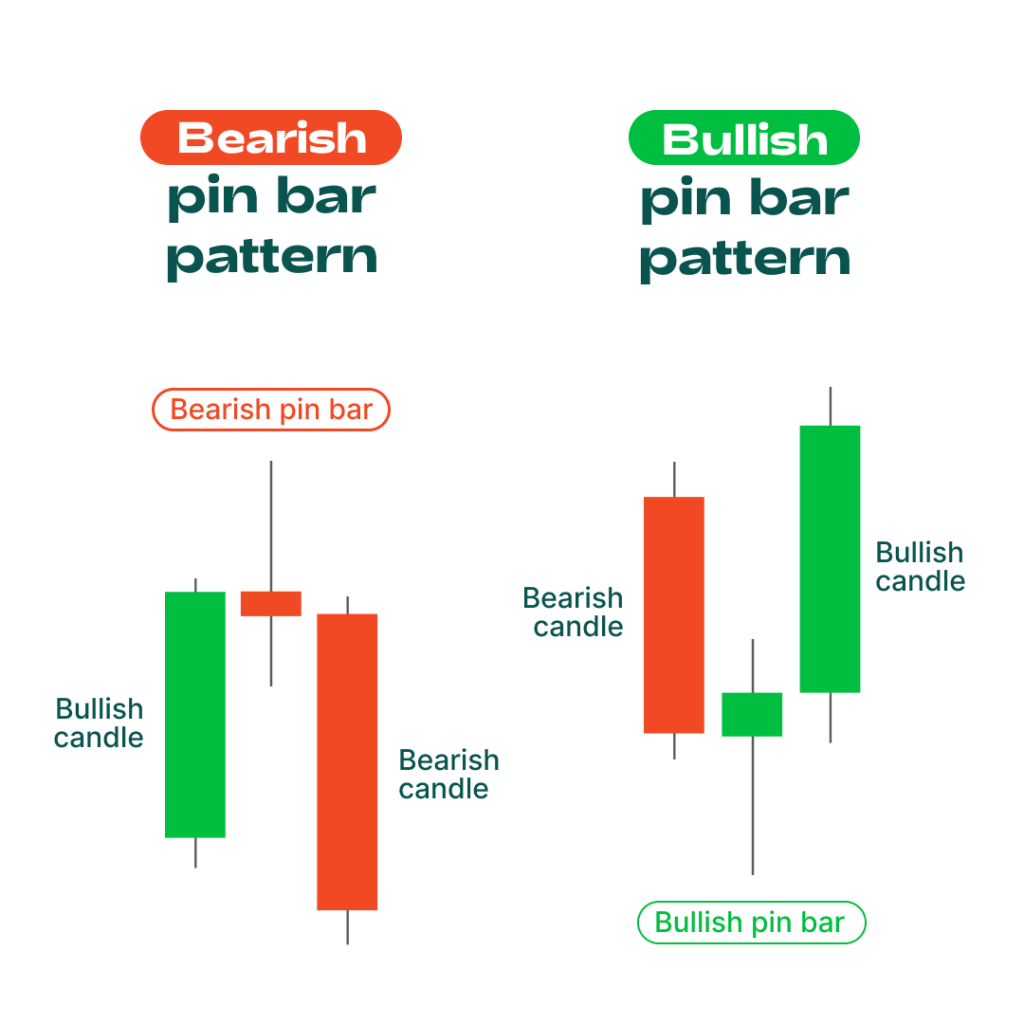
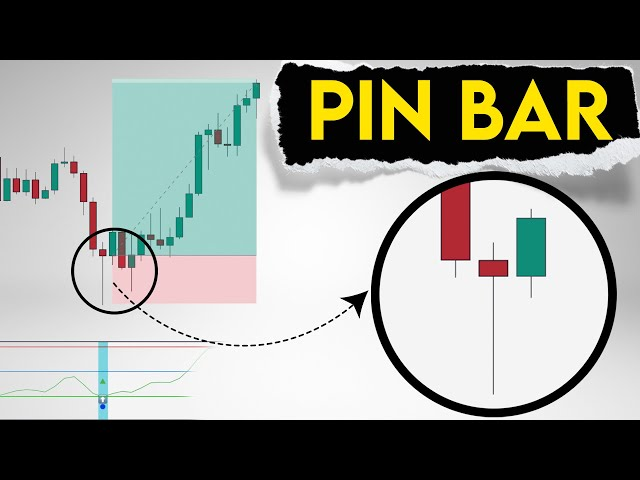
A Pin Bar is a single candlestick pattern characterized by:
- A Small Body: Close and open are close together.
- A Long Wick (Shadow): Represents rejection of a price level.
- Bullish Pin Bar: Long wick below the body, rejecting lower prices.
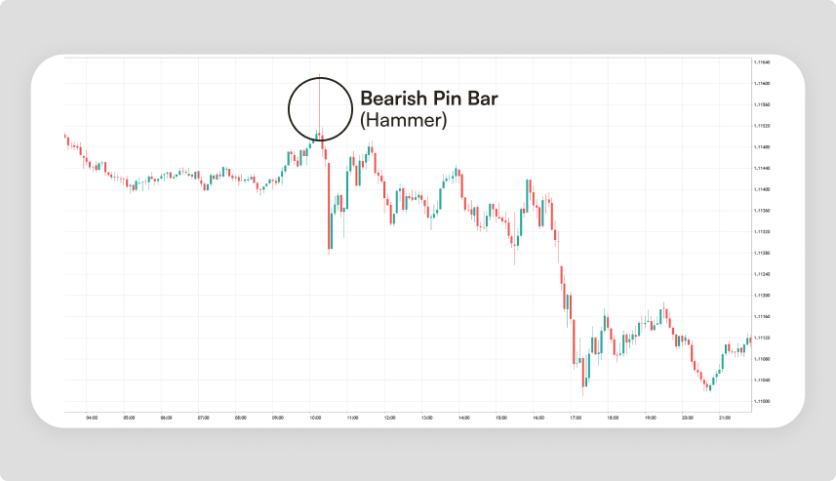
- Bearish Pin Bar: Long wick above the body, rejecting higher prices.
2. How to Identify Pin Bars in ICT
1. Location Matters:
- Appears at significant support/resistance levels, order blocks, or near liquidity pools.
- Example: If a bullish pin bar forms at the lower boundary of an order block, it signals a potential reversal.
2. Confluence with ICT Concepts:
- Combine with FVGs, liquidity sweeps, or optimal trade entry (OTE) zones.
- Example: A bearish pin bar forming after a liquidity sweep above resistance indicates smart money is likely entering shorts.
3. Time Zones:
Pin bars forming during ICT kill zones (e.g., London Open or New York Open) carry higher significance.
3. Trading Pin Bars with ICT
1. Bullish Pin Bar Strategy
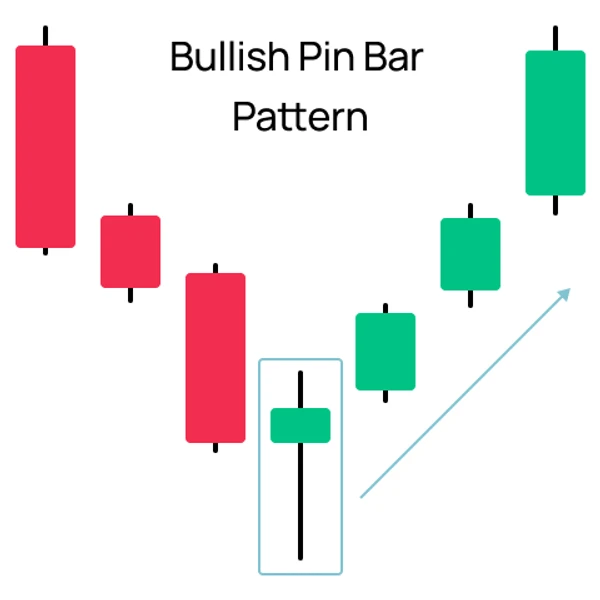
- Setup:
- Identify a bullish pin bar near a bullish order block or demand zone.
- Ensure confluence with a liquidity sweep or FVG.
- Execution:
- Enter a long trade after confirmation (e.g., the next candle closes bullish).
- Place the stop loss below the pin bar’s wick.
- Example:
- EUR/USD forms a bullish pin bar at 1.1050 within a previously identified order block.
- Smart money sweeps sell-side liquidity below 1.1050 and rejects lower prices.
- Enter long at 1.1070, targeting 1.1150.
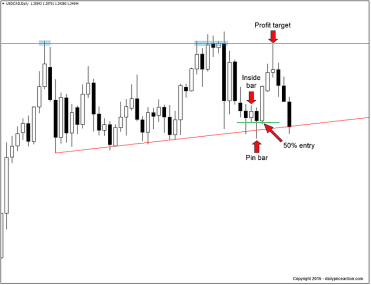
2. Bearish Pin Bar Strategy
- Setup:
- Look for a bearish pin bar near a bearish order block or supply zone.
- Confirm with a liquidity grab or price displacement.
- Execution:
- Enter short after a bearish confirmation candle.
- Place the stop loss above the pin bar’s wick.
- Example:
- GBP/USD forms a bearish pin bar at 1.3200 after sweeping liquidity above a previous high.
- Enter short at 1.3150, targeting 1.3050.
4. Tips for Effective Pin Bar Trading in ICT
1. Combine with FVGs:
Pin bars forming near fair value gaps often signal price rebalancing.
2. Use ICT Tools for Confirmation:
Look for a change of character (CHOCH) or break of structure (BOS) after the pin bar.
3. Focus on Institutional Levels:
Pin bars at institutional price levels (e.g., 1.1000, 1.1100) are more reliable.
5. Common Mistakes to Avoid when Trading Pin Bars in ICT
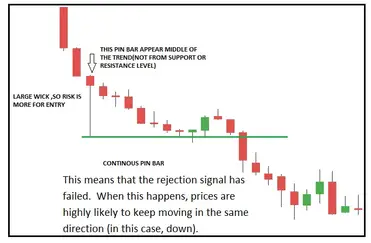
1. Ignoring Context:
A pin bar alone is not a signal; it needs confluence with ICT concepts.
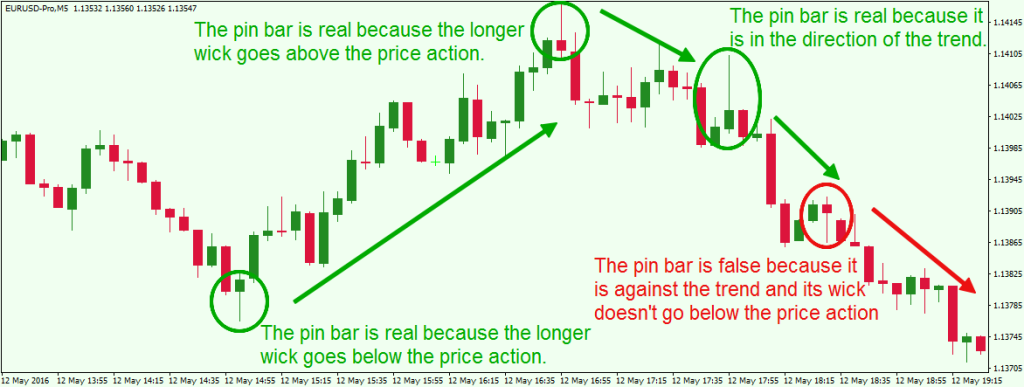
2. Trading Against the Trend:
Pin bars against the prevailing trend are less reliable unless they appear at a strong order block or liquidity zone.
3. Ignoring Time Zones:
Avoid trading pin bars outside ICT kill zones for optimal reliability.
6. Real-Life Example of Trading Pin Bars in ICT
1. Bullish Pin Bar on EUR/USD:
- Price forms a bullish pin bar at 1.1200 during the New York Open, aligned with a fair value gap.
- Smart money sweeps liquidity below 1.1180 before pushing price higher.
- Entry: Long at 1.1220.
- Stop Loss: Below 1.1180.
- Take Profit: 1.1300 at a liquidity pool above recent highs.
7. Final Thoughts
The pin bar is a highly effective pattern when used in conjunction with ICT methodologies.
By focusing on context, confluence, and precision, traders can capitalize on smart money moves while minimizing risk.
Leave a Reply