

The Single Candle Order Block (SCOB) is a simplified yet powerful concept derived from Inner Circle Trader (ICT) trading methodologies.
It identifies key zones where institutional traders or “smart money” leave footprints in the form of a single candlestick, which can indicate a potential market reversal or continuation.
This guide provides an in-depth explanation of SCOB with examples to help traders leverage this tool effectively.
1. What is a Single Candle Order Block (SCOB) in ICT?
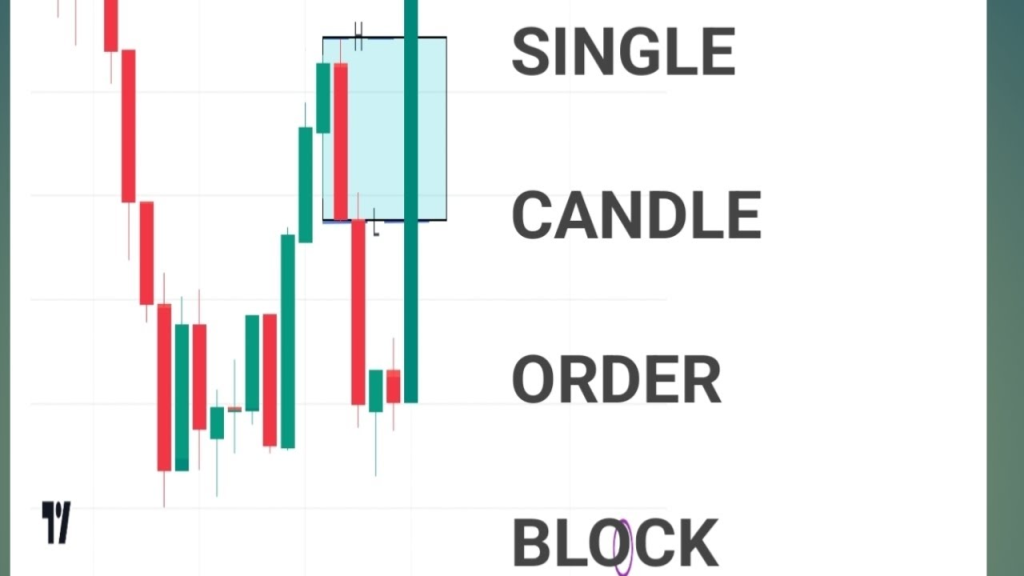
A Single Candle Order Block is a single, prominent candlestick that represents institutional activity.
It typically marks the beginning of a significant price movement and serves as a high-probability level for price retracement or continuation.
1. Characteristics of a SCOB:
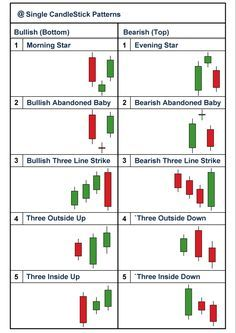
1. Distinct Shape:
- A bullish SCOB is a large bullish candle with minimal or no wick on its upper side.
- A bearish SCOB is a large bearish candle with minimal or no wick on its lower side.
2. Location:
Appears near areas of interest such as support/resistance, liquidity pools, or consolidation zones.
3. Significance:
It indicates where institutional traders may have executed bulk orders, creating a strong directional move.
2. Importance of SCOB in ICT
1. High Probability Zones:
These blocks provide actionable levels for entries, stops, and targets.
2. Market Sentiment:
Indicates strong buying (bullish SCOB) or selling (bearish SCOB) by institutions.
3. Efficient Risk Management:
Tight stop-losses can be placed just below or above the block.
3. How to Identify a SCOB?
- Look for a single large candlestick that stands out in the context of preceding price action.
- Check for volume spikes accompanying the candle, which often indicate institutional participation.
- Ensure the candle aligns with ICT concepts like liquidity sweeps or fair value gaps (FVGs).
4. How to Trade Using SCOB in ICT?
Scenario 1: Bullish SCOB
- Setup: Price drops into a key support zone or liquidity pool, creating a single large bullish candle.
- Action: Enter a buy trade near the SCOB’s open or 50% retracement level.
- Stop-Loss: Below the low of the SCOB.
- Target: Nearby resistance or the next liquidity zone.
Example:
- A bullish SCOB forms at a key support level around 1.2050 on EUR/USD.
- Enter a buy trade at 1.2060 with a stop-loss at 1.2040.
- Target the next resistance at 1.2100.
Scenario 2: Bearish SCOB
- Setup: Price rises into a resistance or liquidity pool, forming a single large bearish candle.
- Action: Enter a sell trade near the SCOB’s open or 50% retracement level.
- Stop-Loss: Above the high of the SCOB.
- Target: Nearby support or the next liquidity zone.
Example:
- A bearish SCOB forms at 1.1500 on GBP/USD at a resistance level.
- Enter a sell trade at 1.1490 with a stop-loss at 1.1510.
- Target the next support at 1.1450.
5. Examples of SCOB in Action in ICT
Example 1: Reversal from Liquidity Sweep
- Context: USD/JPY sweeps liquidity below 140.50.
- Observation: A bullish SCOB forms, closing above 140.60.
- Trade:
- Buy at 140.65.
- Stop-loss at 140.45.
- Target at 141.20.
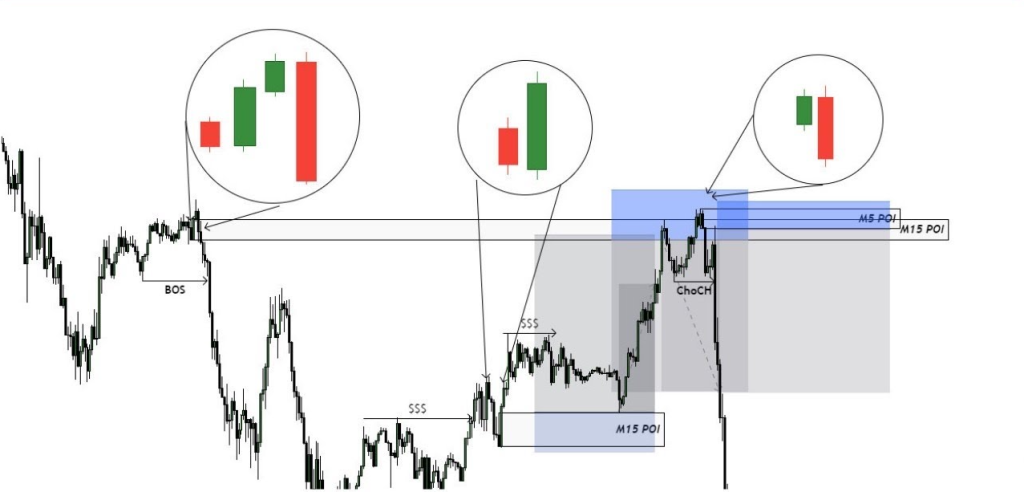
Example 2: Continuation After a Break of Structure (BOS)
- Context: AUD/USD breaks structure above 0.6750.
- Observation: A bullish SCOB forms at 0.6755.
- Trade:
- Buy at 0.6760.
- Stop-loss at 0.6745.
- Target at 0.6800.
6. Tips for Trading SCOBs in ICT
- Combine SCOB with ICT concepts like order blocks, FVGs, and kill zones for better accuracy.
- Validate SCOBs by checking their alignment with institutional timeframes (H1, H4).
- Monitor volume and avoid trading in low-liquidity environments.
7. Limitations of SCOBs in ICT
- False signals can occur in highly volatile markets.
- Requires confirmation from other ICT concepts for higher accuracy.
By integrating Single Candle Order Block strategies with proper risk management and ICT methodologies, traders can enhance their ability to predict market moves effectively.
SCOB serves as a reliable tool to uncover institutional footprints, offering both beginner and advanced traders actionable insights for successful trading.
Leave a Reply