
Support and resistance (S&R) are foundational concepts in trading, and Inner Circle Trader (ICT) elevates their application by integrating them with institutional concepts such as liquidity pools, order blocks, and fair value gaps (FVGs).
Mastering S&R within ICT helps traders predict price movements more accurately and avoid common retail trading traps.
1. What Are Support and Resistance Levels?
1. Support Level:
A price point where demand is strong enough to prevent further price drops.
- Example: If GBP/USD consistently bounces back from 1.3000, this level becomes support.
2. Resistance Level:
A price point where supply is strong enough to prevent further price increases.
- Example: If GBP/USD fails to break above 1.3200, this level acts as resistance.
2. How ICT Refines Support and Resistance
1. Liquidity Pools and Stop Hunts
- In ICT, support and resistance are often areas of liquidity pools where smart money targets retail traders’ stop-loss orders.
- Example: A well-recognized support level at 1.3000 might be manipulated by institutions who drive the price slightly below this level to trigger stops before reversing upward.
2. Order Blocks at S&R Zones
- ICT traders often look for bullish order blocks near support levels and bearish order blocks near resistance levels.
- Example: At resistance (e.g., 1.3200), if a bearish order block aligns, it strengthens the likelihood of a reversal.
3. Dynamic Support and Resistance
- ICT incorporates kill zones and key trading sessions (e.g., London Open) to refine S&R.
- Example: A support level may only hold during high-volume periods like the New York session.
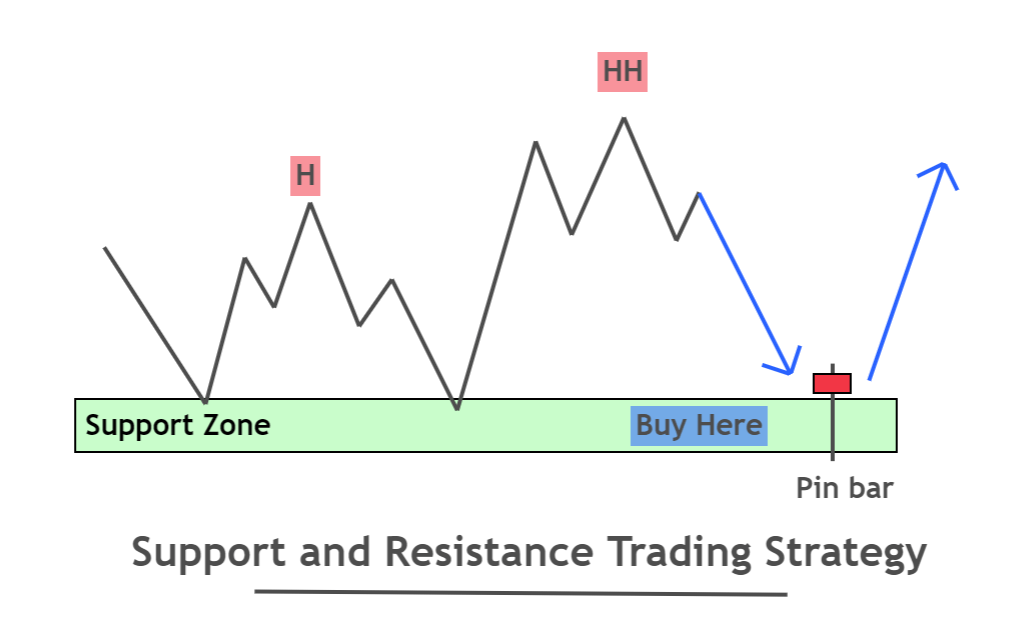
3. ICT’s Support and Resistance Trading Strategy
Step 1: Identify Key Levels
- Use historical price data to mark obvious areas where price reversed multiple times (support and resistance).
- ICT Tip: Align these levels with liquidity pools or imbalance zones for higher accuracy.
- Example: On EUR/USD, a strong support level at 1.1000 coincides with a fair value gap (FVG) from the previous session.
Step 2: Observe Liquidity Behavior
- Analyze whether support or resistance holds or breaks based on liquidity sweeps.
- Example: If price briefly breaks below 1.1000 and reverses sharply, it indicates a liquidity grab designed to trap sellers.
Step 3: Wait for Confirmation
- Look for ICT patterns such as Change of Character (CHOCH) or Break of Structure (BOS) near S&R levels to confirm reversals or continuations.
- Example: At resistance, a bearish BOS confirms that institutions are rejecting higher prices.
Step 4: Align with Institutional Tools
- Combine S&R levels with order blocks, kill zones, and FVGs for precision.
- Example: Price forms a bullish order block near support at 1.1000 during the London Open—indicating a potential long trade.
Step 5: Use Risk Management
- Set stop-loss orders slightly beyond liquidity pools or order blocks to avoid being hunted.
- Example: On a long trade, place a stop-loss below the order block instead of the visible support level.
4. Examples of Support and Resistance in ICT
1. Support Example
- Scenario: EUR/USD approaches a well-established support level at 1.0950 during the New York Open.
- ICT Insight: Institutions sweep liquidity below this level, triggering retail stop-losses.
- Trade: Enter a long position after price reclaims the level, confirming a liquidity grab.
2. Resistance Example
- Scenario: GBP/USD faces resistance at 1.3150, aligning with a bearish order block.
- ICT Insight: Price attempts to break higher but forms a bearish BOS.
- Trade: Enter a short position targeting the next liquidity pool below.
5. Mistakes to Avoid Trading Support & Resistance in ITC
1. Blindly Trusting S&R
- Retail traders often assume S&R will always hold. ICT teaches that these levels are frequently manipulated.
- Example: A breakout above resistance could be a trap if price fails to establish support above the level.
2. Ignoring Kill Zones
- S&R levels are more reliable during high-volume periods.
- Example: A support level may hold during the London session but fail during low-volume Asian trading.
6. Advanced Tips for ICT S&R Trading
1. Combine S&R with ICT Fibonacci Levels
- Use ICT’s premium and discount zones to validate trades near S&R levels.
- Example: A support level at 1.2000 aligns with a 62% retracement, strengthening its validity.
2. Focus on Institutional Zones
- Identify institutional order flow around S&R to predict price direction.
- Example: Price breaking resistance at 1.3150 forms a bullish order block, suggesting institutional buying.
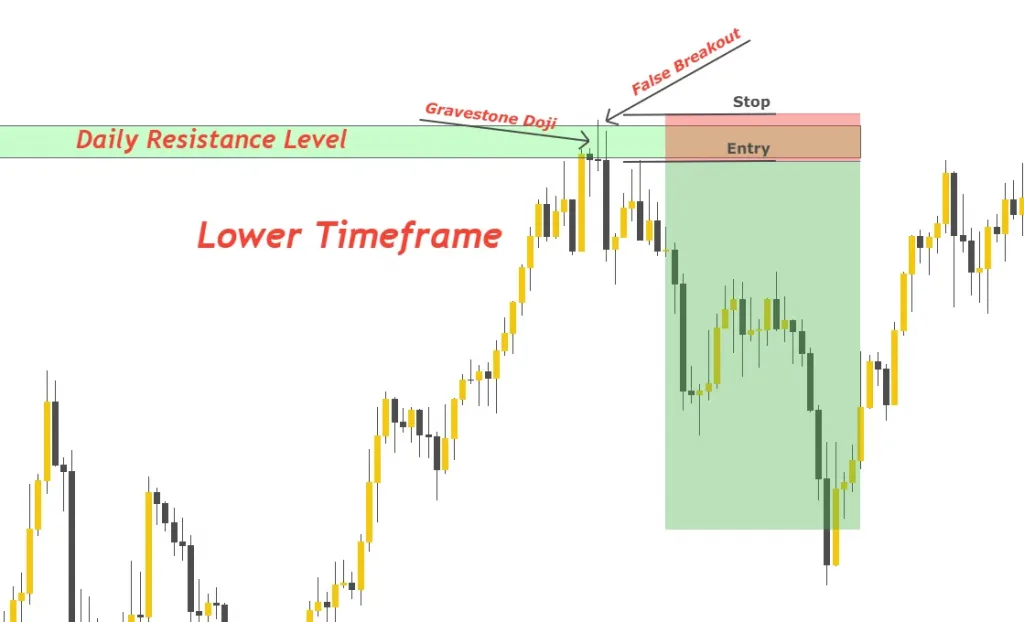
3. Observe Multi-Timeframe Analysis
- Use higher timeframes to identify major S&R zones and lower timeframes for precise entries.
- Example: Weekly resistance at 1.3200 aligns with a 15-minute bearish CHOCH for a short trade.
7. Conclusion
Mastering support and resistance trading using ICT involves moving beyond simple price levels and understanding their connection to institutional liquidity, order blocks, and smart money behavior.
By integrating ICT concepts, traders can refine their approach, increase accuracy, and avoid common retail pitfalls.
This strategy requires patience, discipline, and an analytical mindset, but when executed properly, it can yield consistent results in all market conditions.
Leave a Reply