
Smart money, as defined in ICT (Inner Circle Trader) concepts, often relies on specific candlestick patterns to gauge institutional activity, identify shifts in momentum, and locate key price levels.
By understanding these candlestick patterns, traders can align their strategies with larger, institutional moves.
Here are some of the primary candlestick patterns used in ICT concepts:
1. Order Block Candlesticks
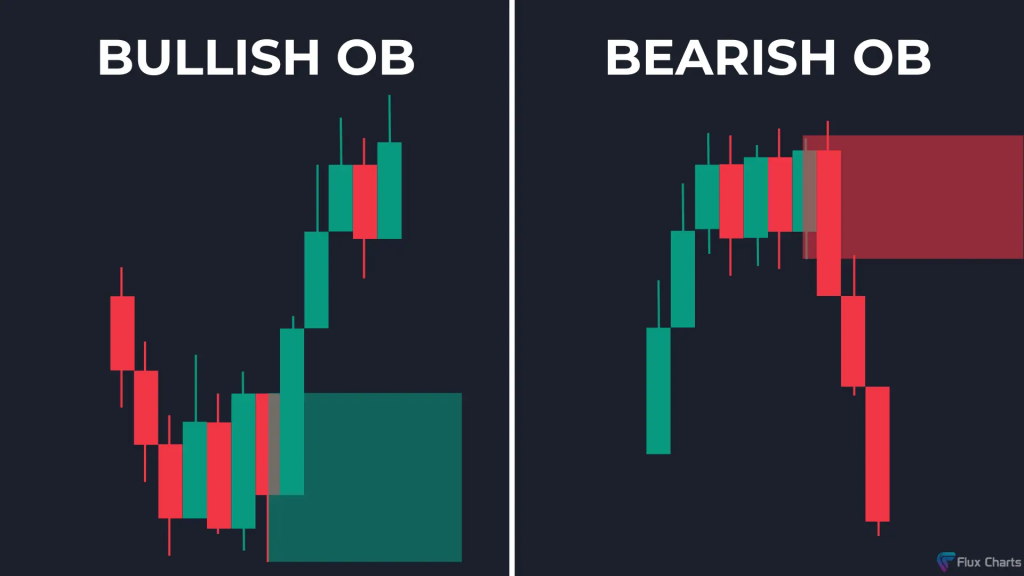
Definition:
An order block is the last bearish or bullish candlestick before a market shift, where institutions likely placed significant orders.
Example:
In an uptrend, a bearish candle at a demand zone can serve as an order block.
When price retraces to this level, traders expect a bullish response, entering long positions in line with institutional order flow.
2. Break of Structure (BOS) Candlesticks
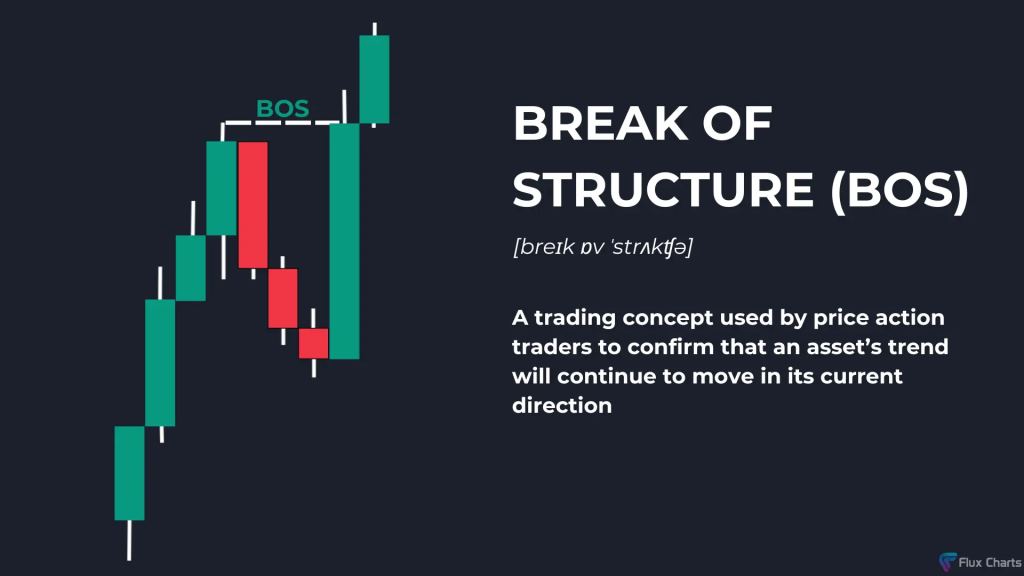
Definition:
A BOS happens when price breaks past a key swing high or low, signaling a potential change in market direction.
Example:
In a downtrend, a bullish candle that closes above the previous swing high may signal a BOS.
This pattern suggests a reversal, where traders look to enter long positions as the trend may shift.
3. Fair Value Gap Candlesticks
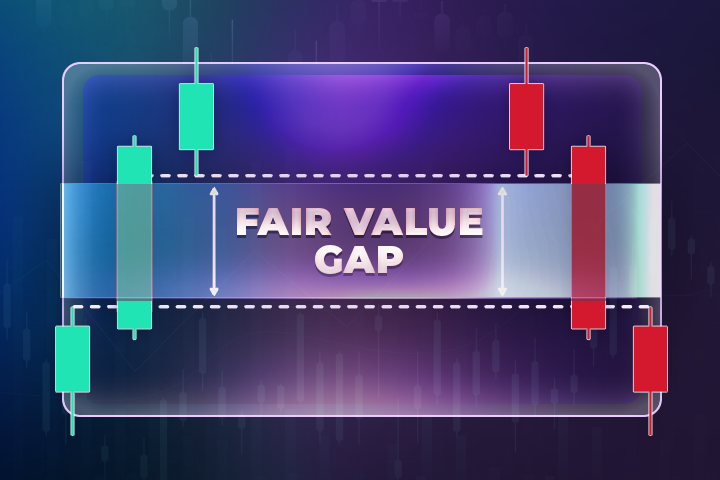
Definition:
FVGs appear when price moves sharply, leaving a gap between two candlesticks.
These gaps act as “imbalances,” areas where price is likely to return to before continuing in the original direction.
Example:
In a bearish move, a sequence of bearish candles leaves a gap between the body and the wick of the previous bullish candle.
When price returns to fill this gap, it often resumes its bearish movement, making it an ideal short entry.
4. Engulfing Candles
Definition:
Engulfing candles occur when a larger candlestick completely engulfs the previous one, indicating a reversal or strong momentum.
Example:
In a downtrend, a bullish engulfing candle (where the bullish candle engulfs the previous bearish one) suggests a strong reversal signal, hinting that smart money may be entering to shift momentum.
5. Doji Candlestick (Gravestone and Dragonfly)
Definition:
Doji candles form when the opening and closing prices are nearly identical, showing indecision.
Gravestone Dojis indicate bearish reversal potential, while Dragonfly Dojis suggest bullish reversal.
Example:
After an uptrend, a Gravestone Doji with a long upper wick suggests selling pressure.
ICT traders may interpret this as an entry point for a short position, aligning with a potential liquidity grab or reversal.
6. Pin Bar Candles (Long Tailed Rejections)
Definition:
Pin bars indicate strong rejections, with a long wick and a small body.
They show where institutions may be pushing prices in the opposite direction.
Example:
In an uptrend, a bearish pin bar with a long upper wick might indicate smart money selling pressure at a resistance level, encouraging traders to enter short positions.
7. ICT Liquidity Sweep Candlesticks
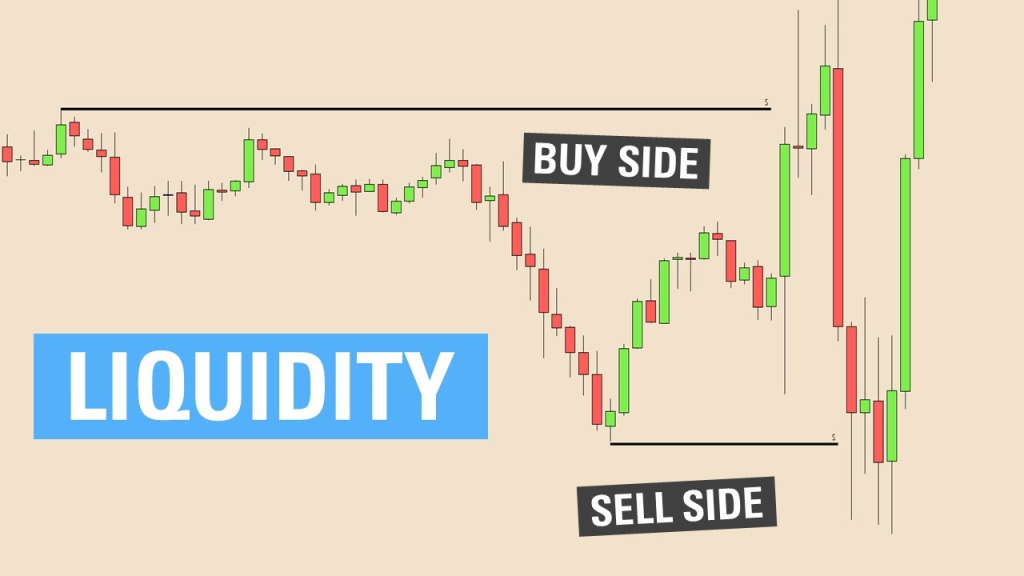
Definition:
A liquidity sweep candle occurs when price temporarily spikes to take out stop orders above a previous high or low before reversing.
Example:
In an uptrend, if price makes a sharp upward spike and then immediately closes below, it could indicate a liquidity sweep above the previous high.
Traders can use this as an opportunity to go short, expecting smart money to reverse price direction.
8. Inside Bar Candlesticks
Definition:
An inside bar is a smaller candlestick that forms within the range of the previous one, often signaling consolidation before a breakout.
Example:
In a consolidation area, an inside bar forms on support.
If followed by a strong bullish candle, it indicates institutional buying, signaling traders to enter long positions on the breakout.
9. Shooting Star and Hammer Candlesticks
Definition:
Shooting stars signal bearish reversals with a small body and long upper wick, while hammers indicate bullish reversals with a small body and long lower wick.
Example:
A shooting star in an uptrend with a strong upper wick shows selling pressure, suggesting smart money may start offloading positions.
Traders can interpret this as a cue to go short.
10. Three-Bar Reversal Pattern
Definition:
A three-bar pattern involves a sequence where the first and third bars move in opposite directions, with the middle bar showing strong momentum.
Example:
In a downtrend, a bullish three-bar reversal pattern forms, where a strong bullish candle appears between two bearish candles.
This suggests institutional buying pressure, and traders may see this as a sign of a potential reversal.
11. Summary of Usage
In ICT trading, candlestick patterns are not only signals for entry or exit but are also indicators of institutional order flow and liquidity manipulation.
By understanding these patterns, traders can strategically align their trades with smart money, identifying high-probability zones in the market.
Leave a Reply