
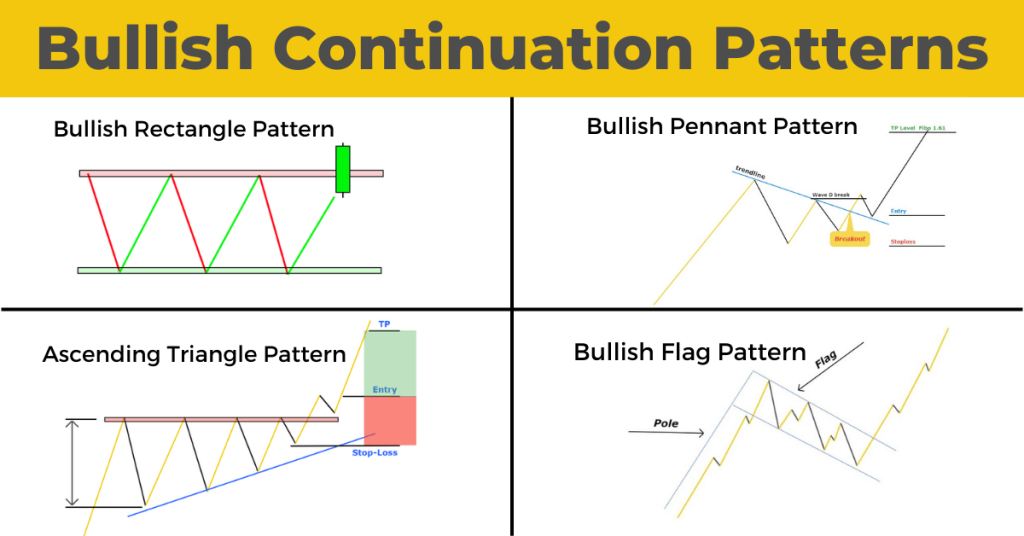
The Bullish Pennant Pattern is a continuation pattern that signifies a brief consolidation during a strong uptrend, followed by a breakout in the direction of the prevailing trend.
In ICT (Inner Circle Trader) trading, this pattern is often used in conjunction with market structure, liquidity zones, and institutional trading concepts to optimize trade entries and exits.
1. Understanding the Bullish Pennant in ICT
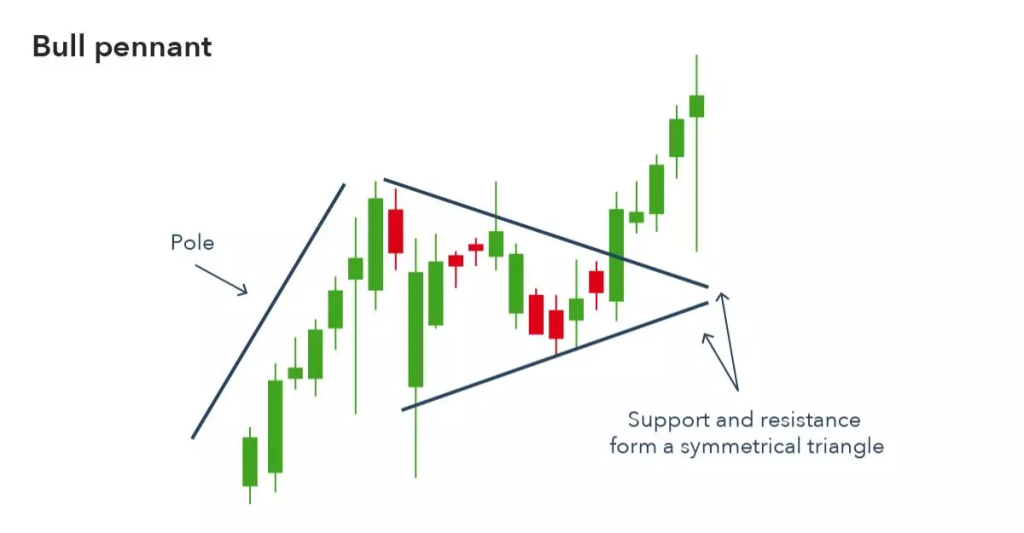
1. Flagpole:
- Represents the strong bullish move leading up to the consolidation phase.
- Indicates strong buying momentum driven by institutional activity.
2. Pennant:
- A small, symmetrical triangle that forms as price consolidates.
- Shows decreasing volume and volatility, signaling a temporary pause before continuation.
3. Breakout:
- The resumption of the bullish trend after the pennant.
- Typically accompanied by increased volume and momentum.
2. Key Characteristics of Bullish Pennant in ICT Context

1. Market Context:
- Appears in trending markets, often during or after key kill zones (e.g., London Open, New York Open).
- Should align with a Higher High or Higher Low in market structure.
2. Liquidity Zones:
- Stops below the pennant’s support level act as liquidity pools.
- Smart money may induce a false breakout (stop hunt) before the actual move.
3. Volume Analysis:
- Declining volume during the pennant indicates consolidation.
- A volume spike confirms the breakout direction.
3. How to Trade the Bullish Pennant in ICT
1. Identify the Pattern
- Look for a sharp upward move (flagpole) followed by a consolidation forming a pennant.
- Ensure the pattern aligns with the prevailing bullish market structure.
Example:
Scenario: GBP/USD moves sharply from 1.2200 to 1.2300, then consolidates between 1.2280 and 1.2320, forming a pennant.
2. Wait for Confirmation
- Avoid entering during the consolidation phase to prevent being trapped in false moves.
- Look for a strong bullish candlestick or ICT displacement move breaking above the pennant’s resistance.
Example:
Breakout: GBP/USD breaks above 1.2320 with a large bullish candle, signaling continuation.
3. Use Liquidity Concepts
- Monitor for a potential liquidity sweep below the pennant before the actual breakout.
- This sweep targets stops and provides smart money the liquidity needed to fuel the next move.
Example:
Liquidity Sweep: GBP/USD dips to 1.2270 (below the pennant), collecting sell-side liquidity, then reverses sharply upward.
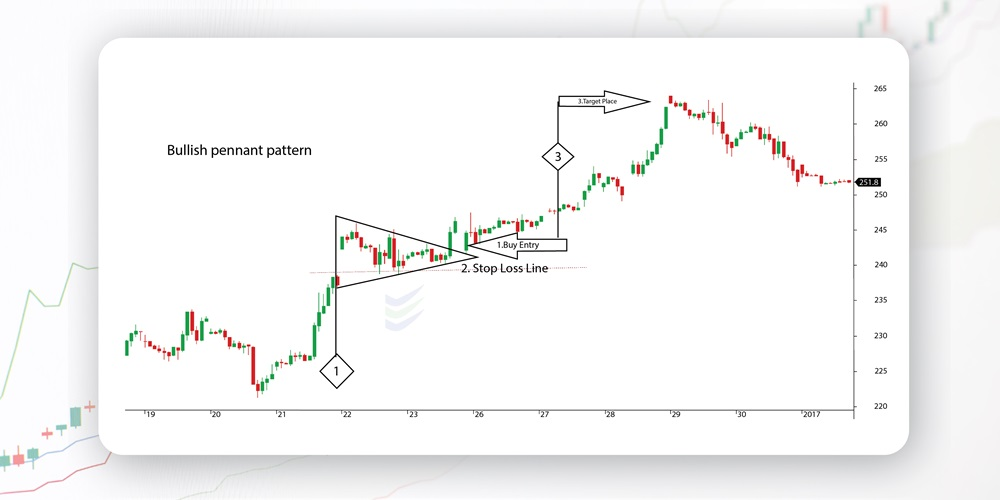
4. Entry and Exit
- Entry: Enter a long trade after the breakout confirms with a bullish close above resistance.
- Stop-Loss: Place the stop-loss below the pennant’s support or the liquidity sweep level.
- Take-Profit: Use the flagpole’s height to project the breakout’s target.
Example:
- Flagpole Height: 1.2200 to 1.2300 = 100 pips.
- Target: Add 100 pips to the breakout level of 1.2320, giving a target of 1.2420.
4. ICT Concepts to Enhance Bullish Pennant Trading
1. Kill Zones:
- Optimal breakout times often align with kill zones like the London Open or New York Open.
- These sessions see increased institutional activity.
2. Fair Value Gaps (FVGs):
Look for FVGs near the pennant’s resistance, as these gaps often act as magnets for price.
3. Order Blocks:
A bullish order block near the pennant’s base strengthens the bullish bias.
Example:
Scenario: The pennant’s base aligns with an order block at 1.2260, providing a high-confidence entry.
5. Real-Life Example of Bullish Pennant Pattern in ICT
Scenario:
- Currency Pair: EUR/USD
- Market Structure: Higher Highs and Higher Lows on a 1-hour chart.
- Pattern Formation:
- Flagpole: Price rises from 1.0800 to 1.0900.
- Pennant: Consolidates between 1.0880 and 1.0920.
- Trade Setup:
- Entry: Long after a breakout above 1.0920 with a bullish displacement candle.
- Stop-Loss: Below the pennant’s support at 1.0870.
- Take-Profit: Target 1.1020 (flagpole height added to breakout level).
6. Common Mistakes to Avoid while Trading Bullish Pennant Pattern in ICT
1. Entering Prematurely:
Wait for a confirmed breakout to avoid false moves.
2. Ignoring Liquidity Sweeps:
Understand that institutions often target stops before the actual breakout.
3. Neglecting Context:
Ensure the pattern aligns with market structure and institutional flow.
7. Conclusion
The Bullish Pennant Pattern is a powerful continuation setup in ICT trading when combined with concepts like market structure, liquidity sweeps, and key kill zones.
By understanding the interplay between candlesticks, structure, and institutional behavior, traders can execute high-probability trades with precise entries and exits.
Leave a Reply