
Combining candlestick analysis with market structure in ICT (Inner Circle Trader) trading involves using candlestick patterns to refine entries and exits while leveraging market structure to understand the broader price context.
This synergy enables traders to identify high-probability trade setups, anticipate reversals, and confirm trend continuations.
1. What is Market Structure in ICT?
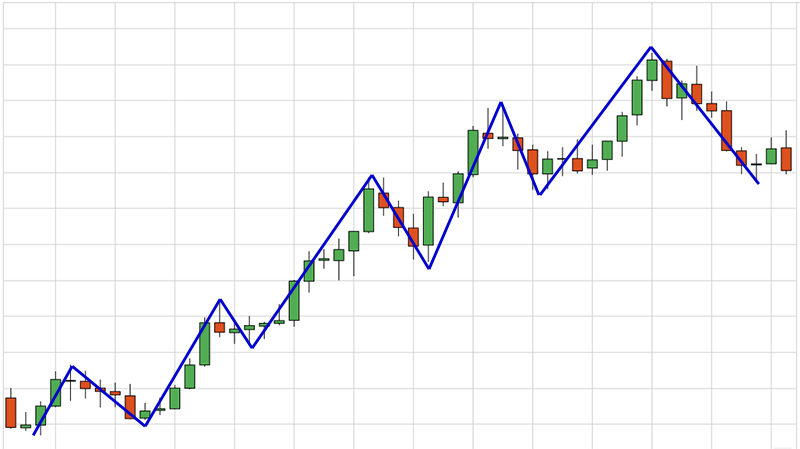
Market structure is the overall framework of price movements, defined by trends and key levels:
- Uptrend: A series of Higher Highs (HH) and Higher Lows (HL).
- Downtrend: A series of Lower Lows (LL) and Lower Highs (LH).
- Consolidation: Price moves sideways within a range, bounded by support and resistance.
2. What is Candlestick Analysis in ICT?
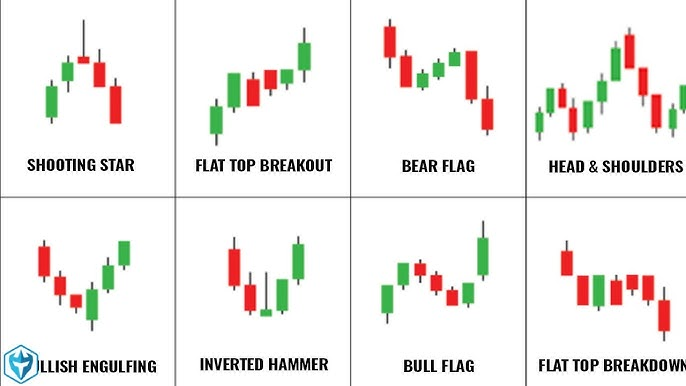
Candlestick patterns provide immediate insight into market sentiment:
- Reversal Patterns: Hammer, inverted hammer, bullish/bearish engulfing, and doji patterns.
- Continuation Patterns: Marubozu, three white soldiers, or three black crows.
- Indecision Patterns: Spinning tops or long-legged dojis.
3. How to Combine Candlestick Analysis with Market Structure in ICT
By overlaying candlestick signals with market structure, traders gain clarity about the timing and context of price movements.
Here’s how:
1. Confirming Market Reversals
When price reaches a critical support or resistance level, candlestick patterns can confirm potential reversals.
Example:
- Scenario: EUR/USD has been in a downtrend, forming Lower Lows and Lower Highs. Price reaches a strong support zone.
- Candlestick Signal: A bullish engulfing pattern forms at support.
- Analysis:
- Market structure suggests a possible pause or reversal near support.
- The bullish engulfing confirms a rejection of lower prices.
- Trade Setup:
- Enter a long trade after the bullish engulfing closes.
- Place a stop-loss below the support zone.
- Target the next resistance level or Higher High.
2. Identifying Continuation Opportunities
In trending markets, candlestick patterns often align with retracements or consolidations before a continuation of the trend.
Example:
- Scenario: GBP/USD is in a strong uptrend, forming Higher Highs and Higher Lows. Price retraces to the most recent Higher Low.
- Candlestick Signal: A hammer candlestick forms at the retracement level.
- Analysis:
- Market structure indicates a potential continuation of the uptrend.
- The hammer shows strong buying interest at the retracement.
- Trade Setup:
- Enter a long trade after the hammer confirms with a bullish close.
- Place a stop-loss below the hammer’s wick.
- Target the next Higher High.
3. Navigating Liquidity Zones
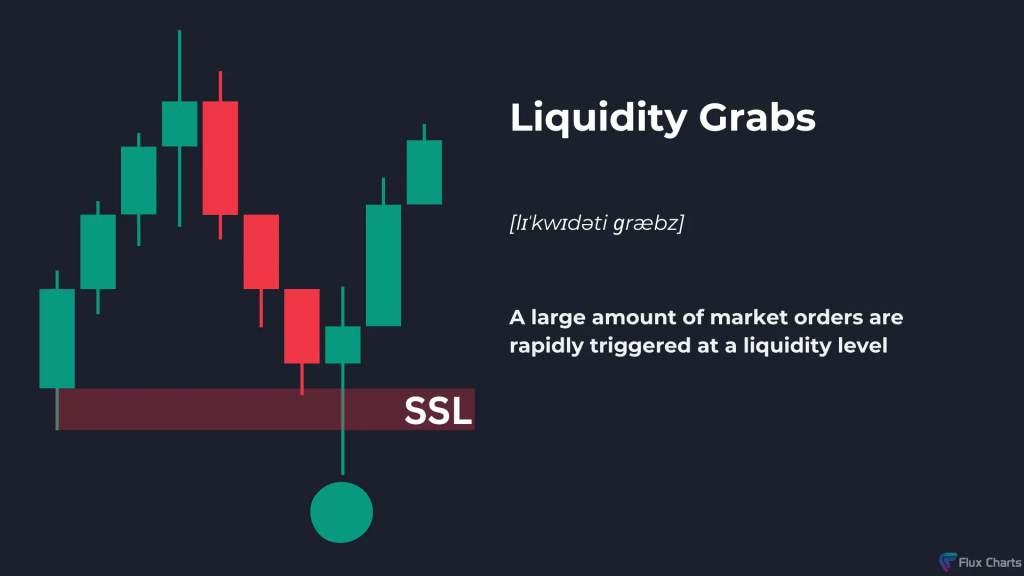
Institutions often target liquidity pools (stop-loss clusters) to fuel their trades.
Candlestick patterns combined with market structure help identify these zones.
Example:
- Scenario: USD/JPY is consolidating in a tight range. A bearish pin bar forms after price wicks above the range high.
- Analysis:
- Market structure indicates the range is a liquidity zone.
- The pin bar suggests a false breakout, targeting stops above the range.
- Trade Setup:
- Enter a short trade after the pin bar closes.
- Place a stop-loss above the range high.
- Target the range low or the next support zone.
4. Break of Structure (BOS) with Candlestick Confirmation
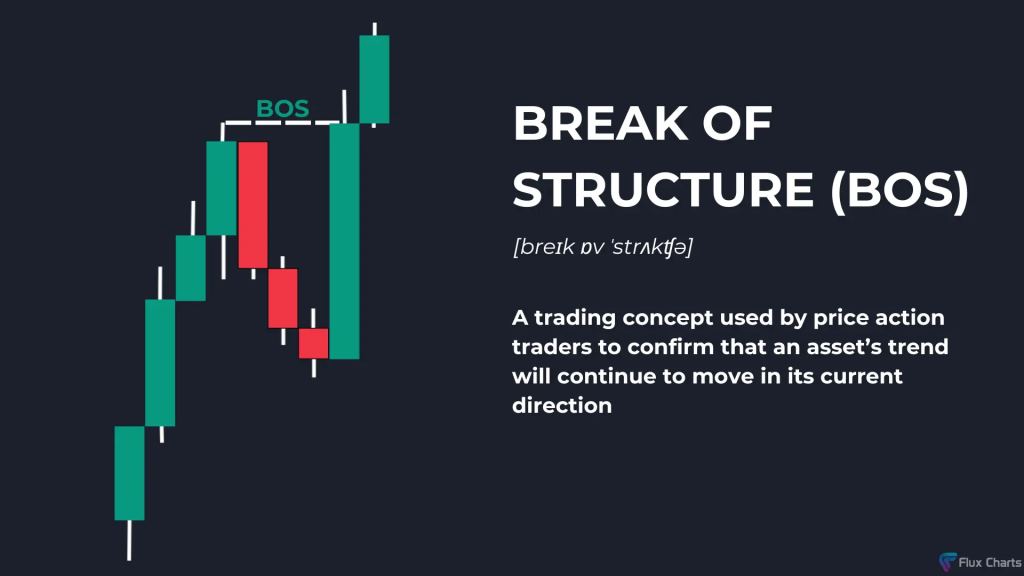
A Break of Structure (BOS) occurs when price breaks a key level, signaling a potential trend shift.
Example:
- Scenario: AUD/USD has been in a downtrend but breaks above a significant Lower High.
- Candlestick Signal: A bullish marubozu candle confirms the BOS.
- Analysis:
- Market structure shift indicates the beginning of an uptrend.
- The marubozu reflects strong buying momentum.
- Trade Setup:
- Enter a long trade on a retracement to the broken level.
- Place a stop-loss below the retracement low.
- Target the next Higher High.
5. Change of Character (CHOCH) with Candlestick Support
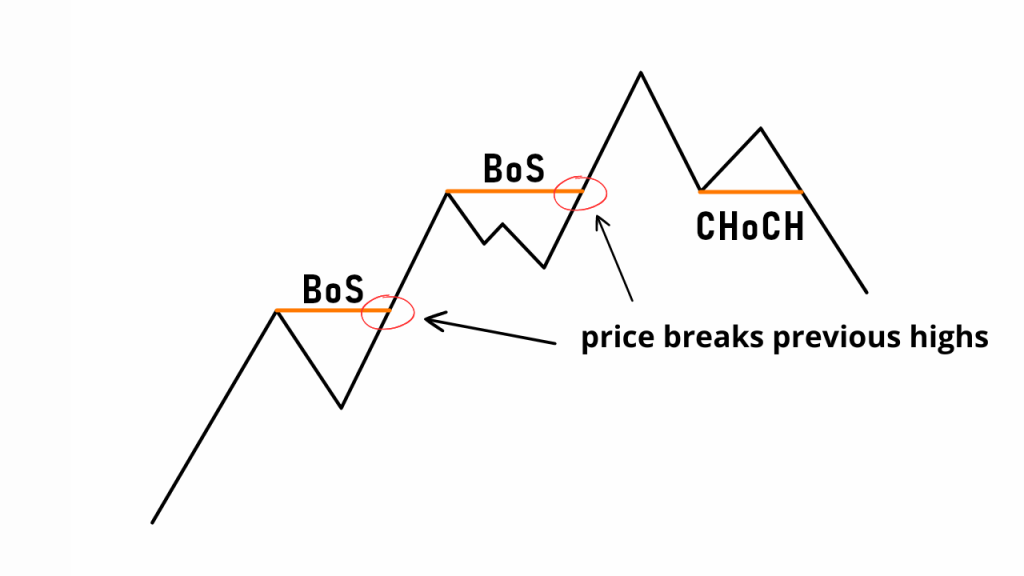
A Change of Character (CHOCH) signals a transition from one trend to another, often confirmed by candlestick patterns.
Example:
- Scenario: NZD/USD is in an uptrend but forms a Lower High and Lower Low.
- Candlestick Signal: A bearish engulfing pattern forms at the Lower High.
- Analysis:
- The CHOCH indicates a potential downtrend.
- The bearish engulfing confirms seller dominance.
- Trade Setup:
- Enter a short trade after the bearish engulfing closes.
- Place a stop-loss above the Lower High.
- Target the next support level or Lower Low.
4. Practical Applications of Combining Candlestick Analysis with Market Structure in ICT
1. Contextual Analysis:
- Use candlestick patterns only at critical levels (support, resistance, or trendlines).
- Avoid relying on isolated candlestick signals without market structure validation.
2. Multiple Time Frames:
- Analyze market structure on higher time frames (4H, Daily) for context.
- Use lower time frames (15M, 1H) for precise entries based on candlestick patterns.
3. Risk Management:
- Place stop-losses beyond significant candlestick wicks or structural levels.
- Use appropriate position sizing based on risk tolerance.
4. Patience and Confirmation:
- Wait for candlestick patterns to close before entering trades.
- Confirm alignment with market structure to avoid false signals.
5. Summary
Combining candlestick analysis with market structure in ICT trading creates a robust approach to understanding price movements.
Market structure defines the broader trend and key levels, while candlestick patterns provide precise entry and exit signals.
Together, they allow traders to align their strategies with institutional flow, maximize profitability, and minimize risk.
Leave a Reply