
The Dragonfly Doji candlestick is a powerful bullish reversal pattern in trading, including in the ICT (Inner Circle Trader) framework.
It typically signals a potential change in trend, especially when found at the bottom of a downtrend or in areas of key support, indicating that sellers are losing control and buyers are stepping in.
In the ICT methodology, candlestick patterns are analyzed with the context of smart money behavior and institutional order flow, rather than being used in isolation.
The Dragonfly Doji is considered an important clue in spotting market reversals initiated by institutional players.
1. What is a Dragonfly Doji?
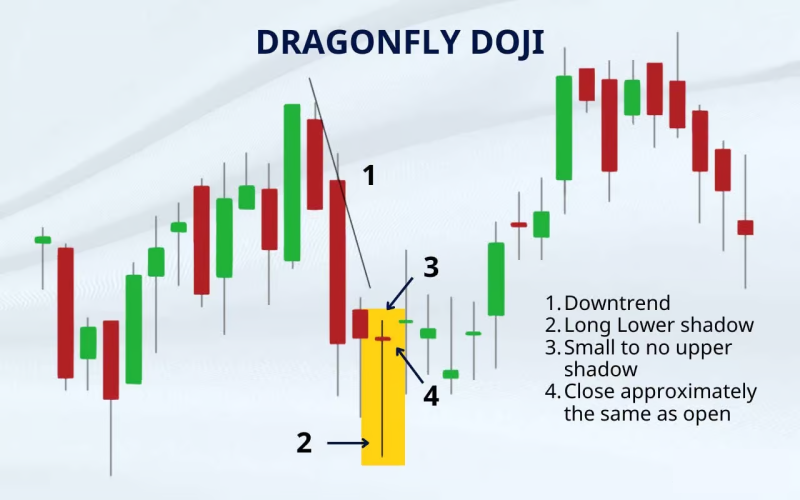
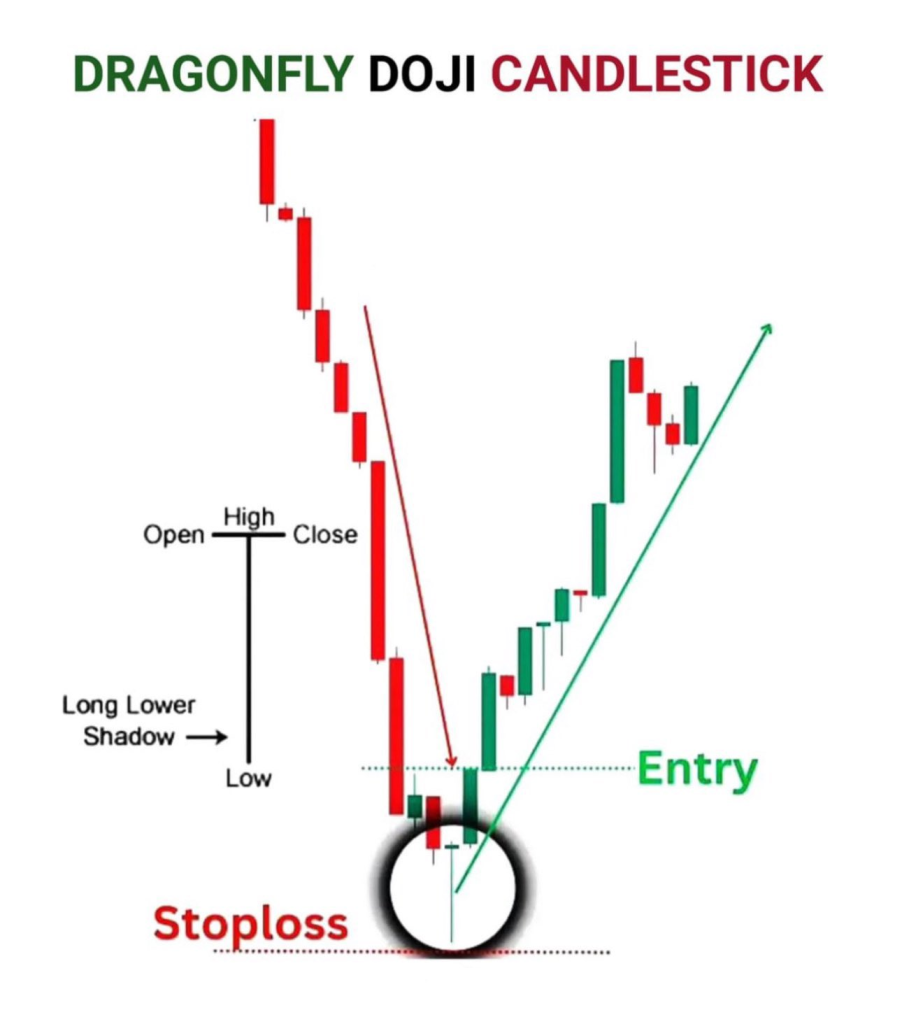
A Dragonfly Doji forms when the opening and closing prices are at or near the same level, while the low of the candle is much lower.
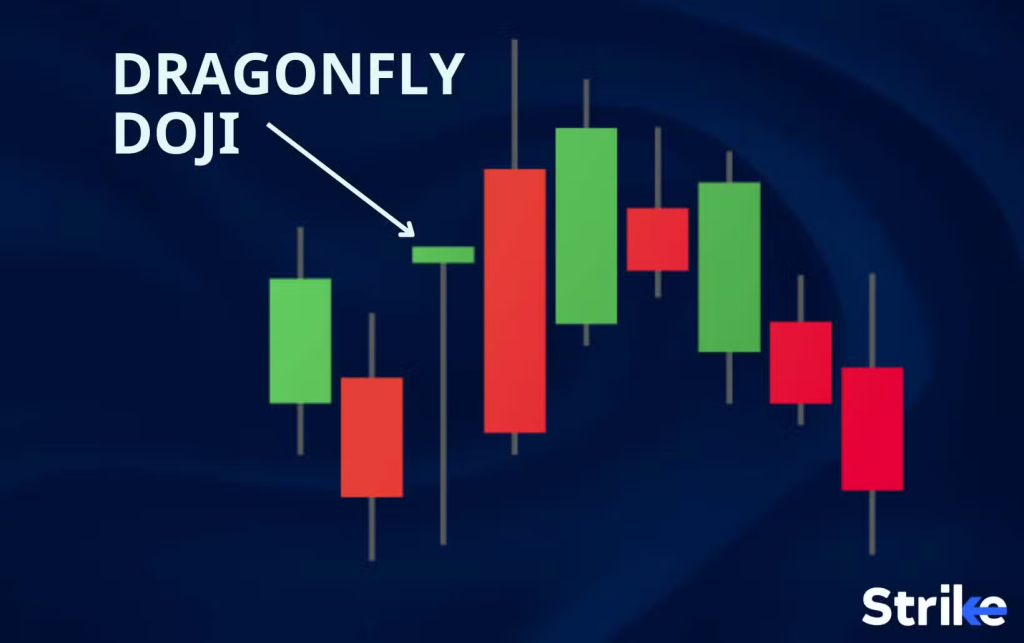
The resulting candlestick looks like a “T” shape, with a long lower shadow and little to no upper shadow.
This formation indicates that sellers were in control for most of the session but were unable to maintain the downward momentum, as buyers drove the price back up to the opening level by the close.
1. Characteristics:
1. Open and Close at the Same Level:
The price opens, drops lower during the session, but closes near the opening price, suggesting a tug-of-war between buyers and sellers, with buyers regaining control.
2. Long Lower Wick:
The long lower wick shows that the market dipped significantly, but buyers stepped in and pushed the price higher, rejecting lower prices.
2. Significance of the Dragonfly Doji in ICT
In the ICT methodology, the Dragonfly Doji is more meaningful when it forms at key levels, such as support zones, order blocks, or areas where liquidity grabs occur.
ICT emphasizes understanding how institutional traders manipulate price to accumulate or distribute their positions.
The Dragonfly Doji can be a signal that institutions are absorbing sell-side liquidity, preparing for a bullish move.
1. Key ICT Concepts in Relation to the Dragonfly Doji:
1. Order Blocks:
The Dragonfly Doji often forms near bullish order blocks, where institutional traders have placed large buy orders.
Price dips into the order block to trigger these buy orders, and the Dragonfly Doji indicates the rejection of lower prices, signaling a bullish reversal.
2. Liquidity Grabs:
In ICT, institutional traders often push the price lower to grab sell-side liquidity (e.g., stop-losses of retail traders) before reversing the price.
The Dragonfly Doji can appear after such liquidity grabs, indicating the market is ready to reverse upward.
3. Fair Value Gaps (FVGs):
A Dragonfly Doji forming near a Fair Value Gap can indicate that price is rebalancing before continuing a bullish move.
2. How to Trade the Dragonfly Doji in ICT

To trade the Dragonfly Doji effectively within ICT strategies, it’s important to combine the candlestick pattern with other market structure and liquidity concepts.
Here’s how to incorporate it into your trading:
1. Look for Context:
A Dragonfly Doji is more powerful when it appears at key areas of interest, such as:
- Order Blocks: If a Dragonfly Doji forms in a bullish order block after a downtrend, it can signal that institutions are accumulating positions and that a reversal is likely.
- Liquidity Grabs: After a stop hunt or liquidity sweep below a significant low, the appearance of a Dragonfly Doji may signal that the institutions have completed their accumulation, and the market is ready to move upward.
2. Confluence with Market Structure:
Before trading based on a Dragonfly Doji, check if the market structure aligns with the reversal signal:
- Bullish Break of Structure (BOS): Look for a BOS after the Dragonfly Doji. If price breaks above a key high, this indicates that the downtrend is over and a new uptrend may be starting.
- Change of Character (CHOCH): In ICT, a CHOCH represents a shift from a bearish market structure to a bullish one. If the Dragonfly Doji forms alongside a CHOCH, it strengthens the bullish reversal case.
3. Wait for Confirmation:
In ICT, waiting for confirmation before entering a trade is crucial.
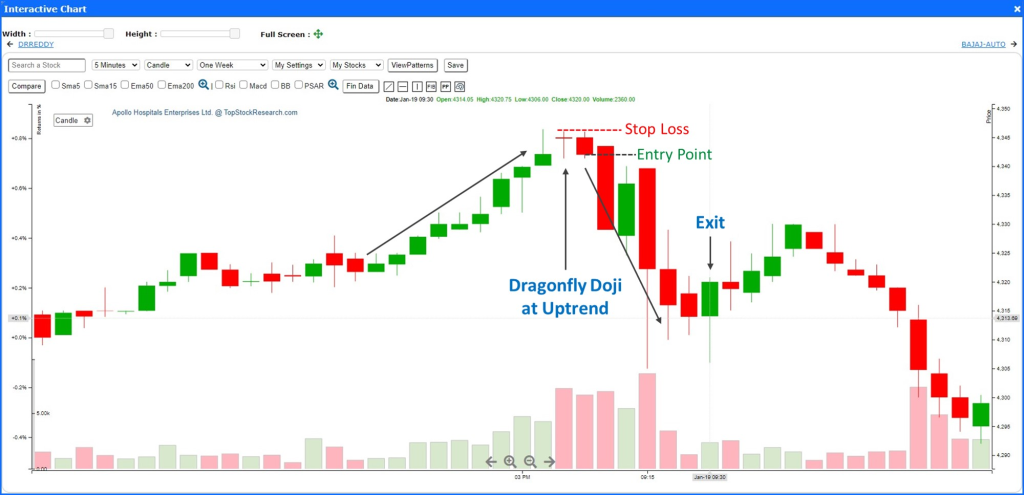
After the Dragonfly Doji forms, wait for price to close above the high of the candle.
This shows that buying pressure is continuing and confirms the potential reversal.
4. Use Fair Value Gaps for Entry:
If price retraces into a Fair Value Gap near the Dragonfly Doji, this can provide a precise entry point for a long trade.
ICT teaches that institutions often use these gaps to rebalance their orders, making them high-probability areas for entries.
3. Example to Trade the Dragonfly Doji in ICT:
Imagine the GBP/USD currency pair is in a downtrend, with the price falling steadily over the past few days.
It reaches a key support level at 1.3000, where a bullish order block is located.
After dipping below 1.3000, price quickly rebounds, forming a Dragonfly Doji with a long lower shadow, indicating a rejection of lower prices.
This Dragonfly Doji forms after a liquidity grab, where the price dipped below 1.3000, triggering stop-losses of retail traders.
Institutions use this liquidity to accumulate long positions.
Following the Dragonfly Doji, price breaks above a previous high (Bullish BOS), confirming that institutions are driving the market upward.
In this scenario, you could enter a long trade above the high of the Dragonfly Doji, with your stop-loss placed below the low of the candle, targeting higher levels of resistance.
4. Conclusion
The Dragonfly Doji is a significant bullish reversal pattern, especially when used within the framework of ICT concepts.
By understanding how institutions operate and combining this candlestick pattern with order blocks, liquidity grabs, and market structure, traders can improve their ability to spot high-probability reversal setups.
Always look for confirmation and align your trades with smart money behavior to increase the chances of success.
Leave a Reply