
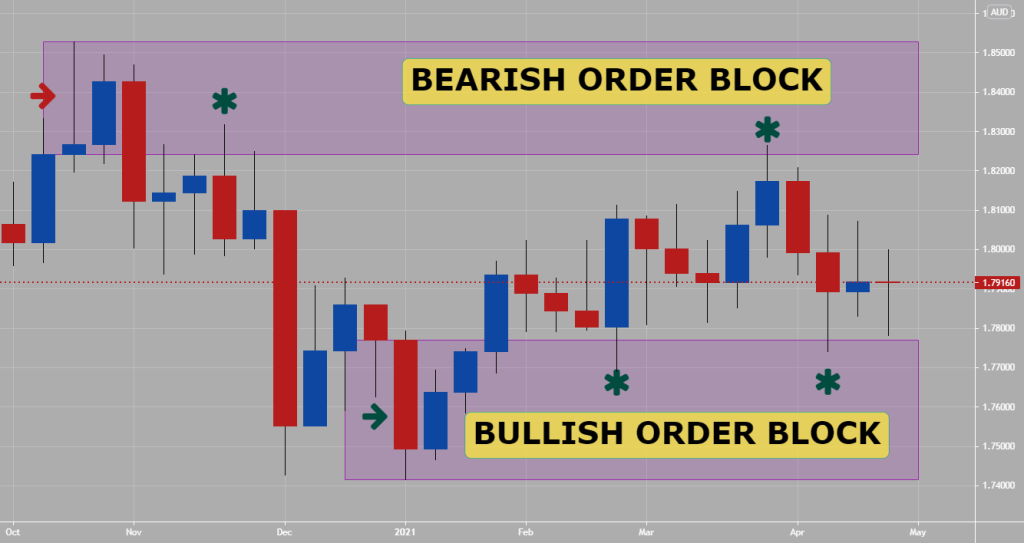
In ICT (Inner Circle Trader) methodology, a Bearish Order Block refers to the last bullish candlestick (or series of bullish candles) before a significant downward price move occurs.
This block is seen as a zone of institutional interest where smart money has placed sell orders. It often acts as a resistance zone and a potential entry point for short trades.
1. Key Features of a Bearish Order Block in ICT

1. Precedes a Downward Move:
It marks the point where institutional players initiated large sell orders, causing the price to drop significantly.
2. Acts as Resistance:
Price often retraces to this zone before continuing the downward trend, making it an ideal area for trade entries.
3. High Volume Area:
It often aligns with zones of increased trading activity.
4. Smart Money Footprint:
Represents where institutions entered the market aggressively.
2. How to Identify a Bearish Order Block in ICT

1. Look for the Last Bullish Candle:
Before a sharp bearish move, identify the final bullish candle(s).
2. Observe Market Reaction:
A strong downward move should follow the bullish candle, breaking key levels such as a previous swing low or support level.
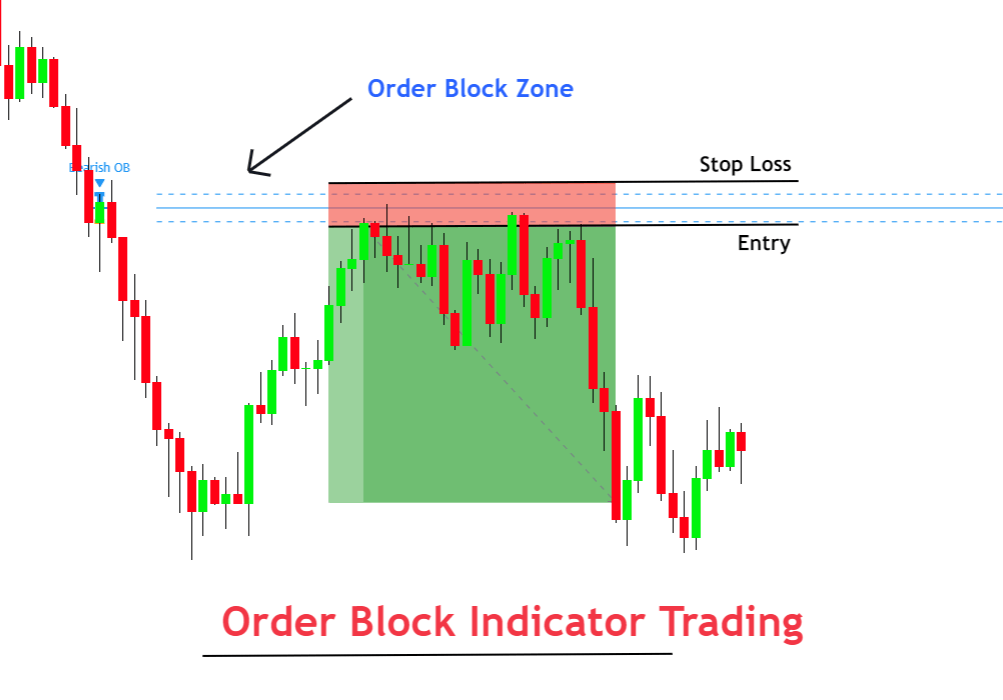
3. Mark the Zone:
Extend the range of the bullish candle to identify the bearish order block zone.
4. Wait for a Retest:
Price often retraces to this zone, offering a high-probability entry point for short trades.
3. Examples of Bearish Order Blocks
Example 1: EUR/USD Daily Chart
- Scenario:
- EUR/USD has been in a minor uptrend, creating a bullish candle at 1.2000.
- The next day, the price drops sharply to 1.1850, breaking the previous swing low.
- Identifying the Order Block:
- The last bullish candle before the drop is the bearish order block.
- Mark the high and low of this candle (e.g., 1.2010 to 1.1990).
- Trade Opportunity:
- When the price retraces to 1.2000, observe bearish price action, such as a bearish engulfing pattern, to enter a short trade.
- Target: 1.1800 (next liquidity pool).
- Stop-loss: Above 1.2020.
Example 2: GBP/USD 4-Hour Chart
- Scenario:
- GBP/USD has been consolidating, forming a bullish candle at 1.3200 before a sharp drop to 1.3100.
- Order Block Zone:
- The last bullish candle at 1.3200 is identified as the bearish order block.
- Extend this zone forward on the chart.
- Market Reaction:
- Price retraces to 1.3190, showing a rejection with a shooting star candlestick.
- Enter a short trade, targeting 1.3050, with a stop-loss above 1.3220.
4. Why Bearish Order Blocks Work in ICT

1. Institutional Footprint:
Reflects zones where large institutional sell orders were placed.
2. Liquidity Sweep:
Often aligned with liquidity pools, where retail traders’ stop-losses are triggered before the price reverses.
3. Market Psychology:
Retail traders interpret the retracement as a bullish reversal, but institutions use it to add to their short positions.
5. Tips for Trading ICT Bearish Order Blocks
1. Confluence is Key:
Combine with other ICT tools like fair value gaps (FVGs), liquidity pools, or Fibonacci retracements.
2. Wait for Confirmation:
Ensure price shows a clear rejection or reversal pattern within the order block zone.
3. Use Multiple Timeframes:
Identify order blocks on higher timeframes and refine entries on lower timeframes.
4. Risk Management:
Always place stop-loss orders above the high of the order block.
6. Common Mistakes
1. Forcing Trades:
Not all bullish candles before a downtrend are valid order blocks. Look for clear signs of institutional activity.
2. Ignoring Context:
Ensure the bearish order block aligns with the broader market structure and trend.
3. Overlooking Volume:
Pay attention to volume surges as an indication of institutional involvement.
7. Conclusion
The ICT Bearish Order Block is a powerful concept that highlights zones of institutional interest in the market.
By combining it with other ICT tools and strategies, traders can gain precise entry points for high-probability short trades.
Understanding its dynamics and practicing its application is key to mastering this tool in trading.
Leave a Reply