
Reversal trading is a powerful approach in Inner Circle Trader (ICT) methodology, focusing on identifying the precise moments when the market shifts direction.
Institutional traders (smart money) often engineer these reversals by targeting liquidity, exploiting retail trader behavior, and aligning trades with market structure shifts.
Here’s how reversals can be effectively traded using ICT concepts, with detailed explanations and examples.
1. Key Components of ICT Reversal Trading
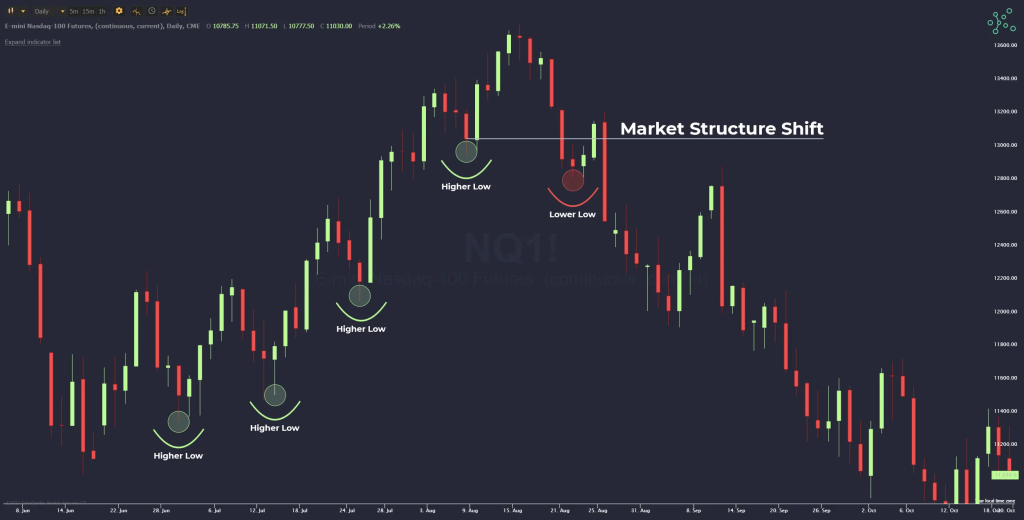
1. Market Structure Shifts (Break of Structure – BOS and Change of Character – CHoCH)
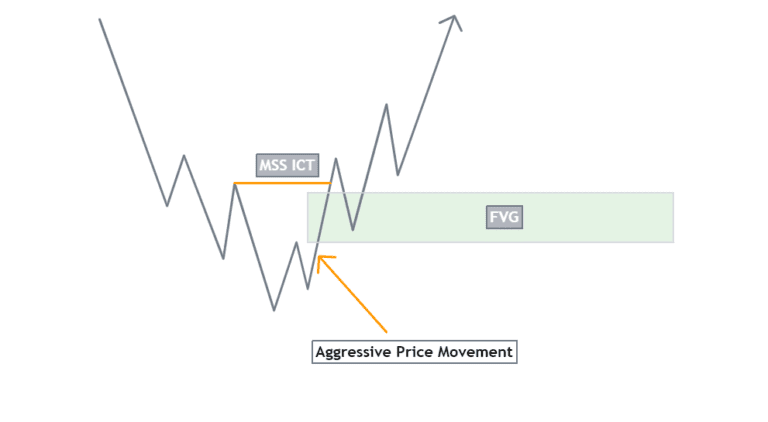
Reversals often occur when the market transitions from one trend to another, identified by a shift in market structure.
Example: In an uptrend, a lower high (LH) followed by a lower low (LL) signals a bearish reversal.
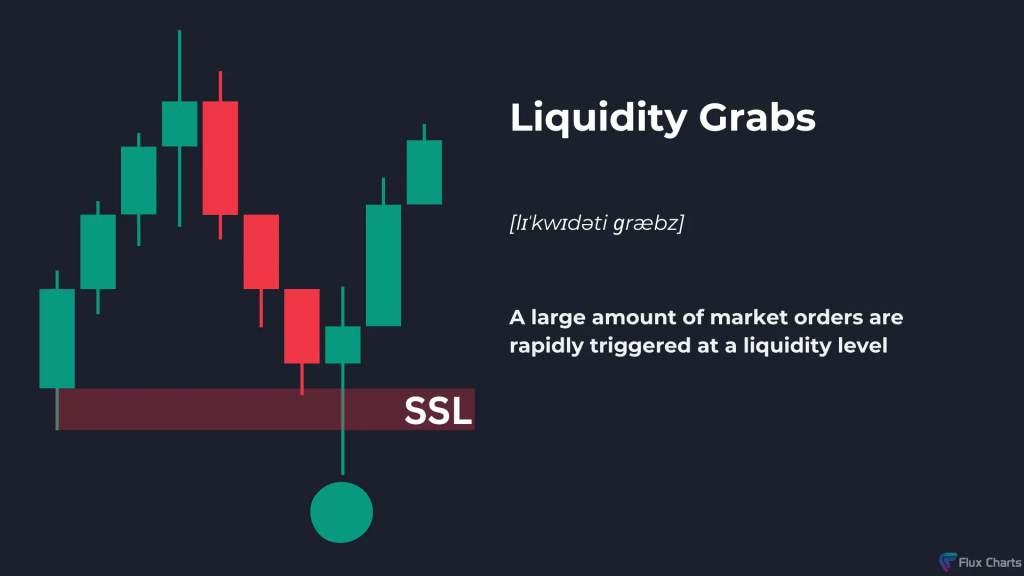
2. Liquidity Sweeps
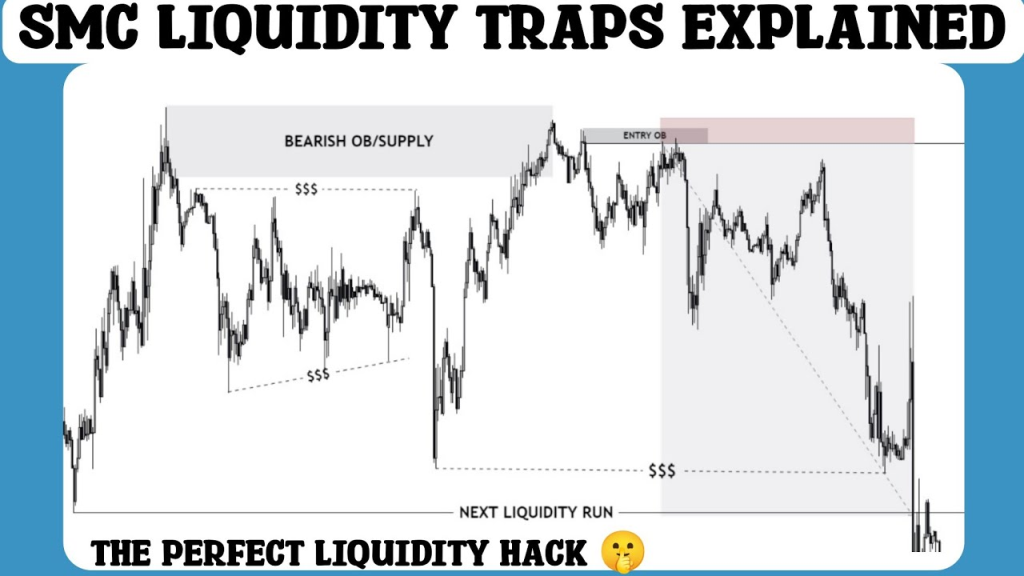
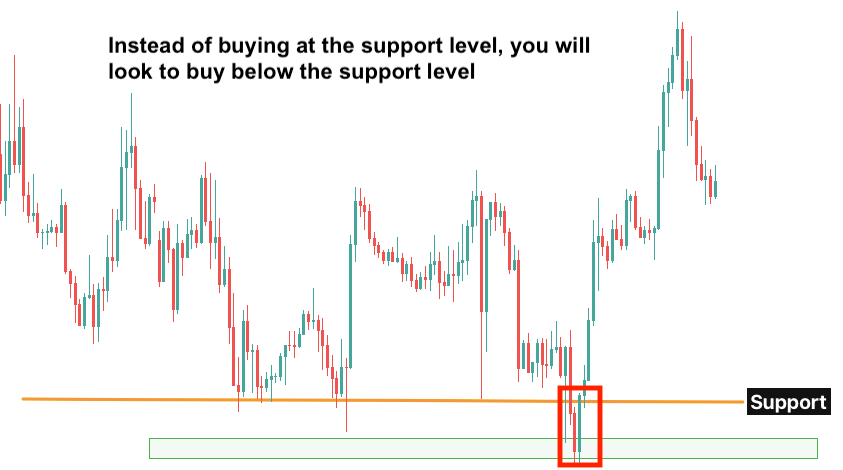
Before reversing, institutions typically target liquidity above swing highs or below swing lows to trap retail traders.
Example: Price spikes above a key resistance level to grab stop-loss orders before sharply reversing downward.
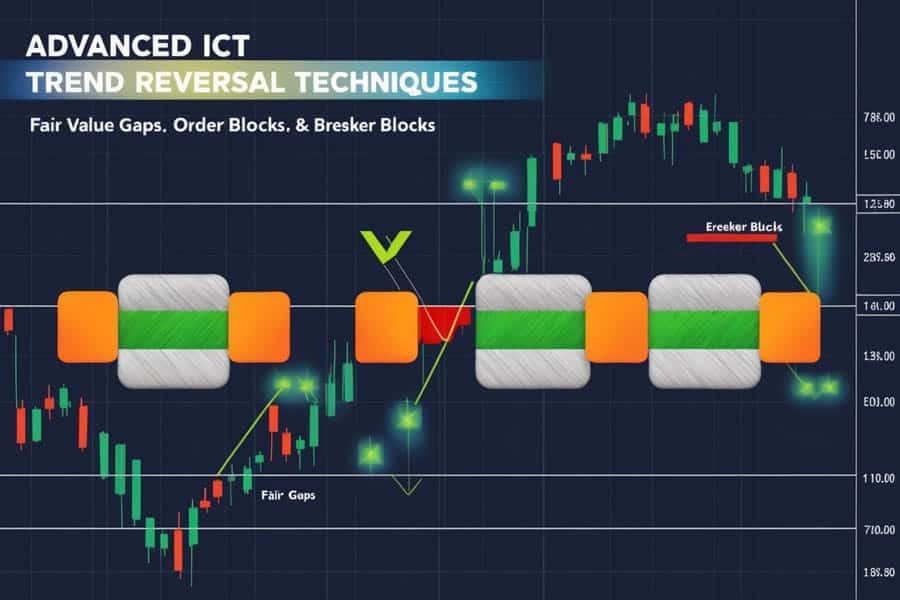
3. Order Blocks (OBs)

Order blocks, particularly bullish or bearish OBs, indicate where institutions are entering trades, often serving as pivot points for reversals.
Example: After a liquidity sweep, price retraces to a bearish OB and then resumes in the direction of the reversal.
4. Fair Value Gaps (FVGs)
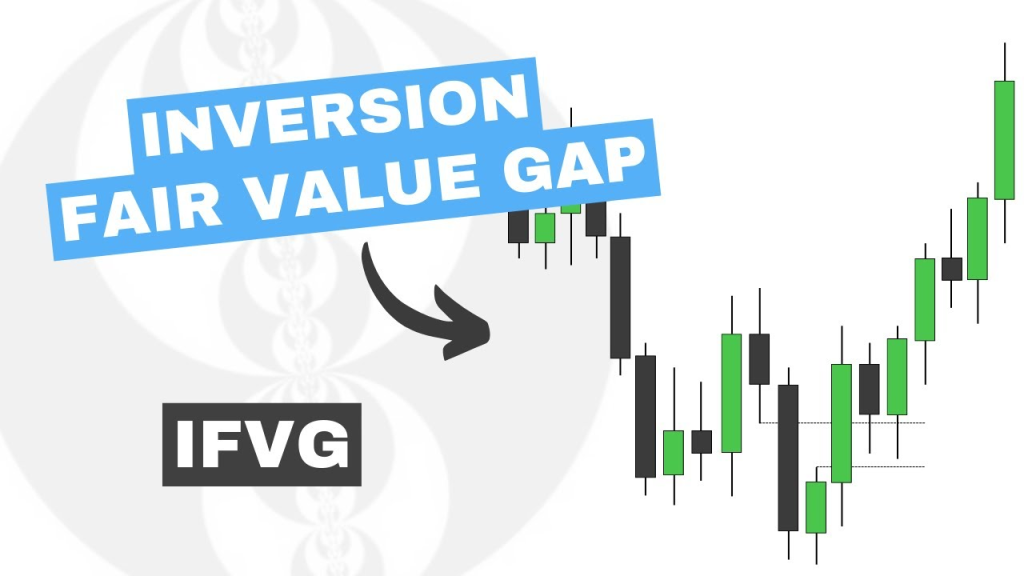
Reversals frequently fill fair value gaps, confirming imbalance correction and institutional order flow.
Example: Price reverses after filling an FVG on a higher timeframe.
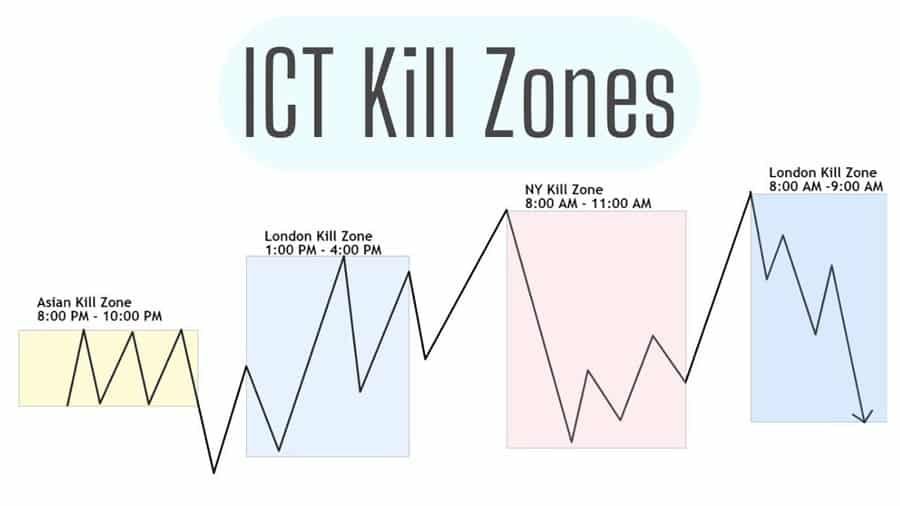
5. Time-Based Killzones
Reversals are more likely to occur during high-volume trading sessions like the London Open, New York Open, or other ICT killzones.
2. Steps to Trade Reversals Using ICT Concepts
1. Identify High-Impact Liquidity Zones
Look for areas with significant liquidity, such as:
- Swing highs/lows.
- Major support and resistance levels.
- Psychological price levels (e.g., round numbers like 1.2000 in EUR/USD).
Example:
On the GBP/USD 1-hour chart, a swing high at 1.2450 aligns with a previous resistance level.
2. Monitor for a Liquidity Grab
Watch for price to sweep the liquidity above or below these zones, often forming wicks or pin bars on higher timeframes.
This signals that institutions are grabbing liquidity to fuel the reversal.
Example:
GBP/USD spikes above 1.2450, forming a long wick up to 1.2470 before sharply retreating below the level.
3. Confirm Market Structure Shift
After the liquidity grab, wait for a Break of Structure (BOS) or Change of Character (CHoCH) to confirm the trend reversal.
Example: A new lower low (LL) forms on GBP/USD, confirming the bearish reversal.
4. Look for Entry at Order Blocks or FVGs
Enter trades at key order blocks or fair value gaps near the reversal zone.
Use lower timeframes (e.g., 5M or 15M) for precision entries.
Example:
GBP/USD retraces to a bearish OB at 1.2440 after the liquidity grab, providing an entry point for a short trade.
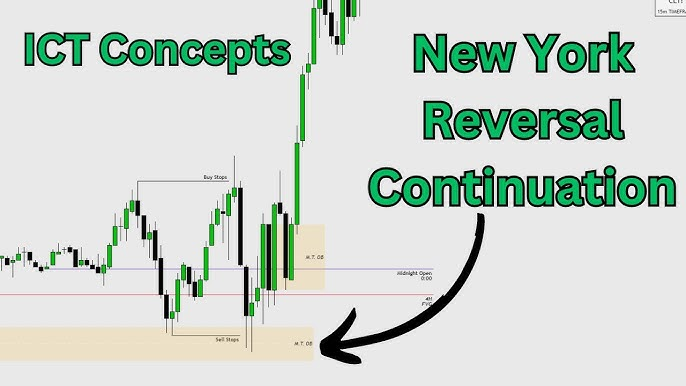
5. Align with Killzones
Ensure your trade setup aligns with ICT killzones, as these periods often coincide with institutional moves.
Example:
The liquidity sweep and reversal on GBP/USD occur during the New York Open.
6. Set Stop Loss and Target
Place stop losses above the liquidity sweep or the reversal pattern’s high/low.
Target the next significant liquidity zone or structural level.
Example:
- Stop loss: Above the liquidity grab at 1.2480.
- Target: Previous support at 1.2350.
3. Examples of Reversal Trades Using ICT Concepts
1. Bullish Reversal Example (EUR/USD)
- Scenario: EUR/USD in a downtrend, creating a swing low at 1.0800.
- Steps:
- Price dips below 1.0800 to 1.0785, sweeping stop-loss liquidity.
- A bullish engulfing candle forms on the 15-minute chart, confirming reversal interest.
- Price retraces to a bullish OB at 1.0810.
- Enter a long trade at 1.0810 with a stop loss at 1.0780.
- Target 1.0900, the next liquidity pool.
2. Bearish Reversal Example (USD/JPY)
- Scenario: USD/JPY in an uptrend, creating a swing high at 150.50.
- Steps:
- Price spikes to 150.80, sweeping liquidity above the swing high.
- A bearish pin bar forms on the 1-hour chart, signaling rejection.
- Price retraces to a bearish OB at 150.60.
- Enter a short trade at 150.60 with a stop loss at 150.90.
- Target 149.50, the next support level.
4. Reversal Patterns in ICT
1. Candlestick Patterns:
Pin bars, engulfing candles, and inside bars often mark reversals at liquidity zones.
2. Divergences:
Use RSI or MACD to identify bullish or bearish divergences at key levels.
3. Market Structure Breaks:
Higher lows or lower highs confirm trend reversals in alignment with liquidity grabs.
5. Tips for Successful ICT Reversal Trading
1. Focus on High-Volume Sessions
Reversals are most reliable during the London and New York sessions.
2. Combine Multiple ICT Tools
Use order blocks, fair value gaps, and killzones for confirmation.
3. Risk Management is Key
Always use tight stop losses and aim for a favorable risk-to-reward ratio (1:2 or better).
6. Final Thoughts
Trading reversals using ICT concepts involves patience, precision, and a deep understanding of market dynamics.
By focusing on liquidity grabs, market structure shifts, and institutional trading patterns, traders can effectively align their trades with smart money moves.
Practice on a demo account and refine your skills with real-time analysis before applying these strategies in live markets.
Leave a Reply