TradingView is one of the most popular platforms for charting, market analysis, and trade ideas.
It is widely used by beginners, professional traders, and even institutions.
If you’re just getting started, this step-by-step tutorial will guide you through Registration, Symbols, and Screener in TradingView with examples.
1. Step 1: Registration on TradingView

To use TradingView, you first need to create an account.
- Go to the official website: www.tradingview.com.
- Click Get Started or Sign Up at the top right.
- You can register using:
- Google account
- Apple ID
- Facebook, or other options
Example: If you sign up with your Gmail account, just click Continue with Google → Choose your Gmail → Allow access → Done.
Once registered, you’ll be taken to your dashboard.
Tip: TradingView has free and paid plans.
The free plan works well for beginners.
Paid plans unlock more charts per window, more indicators, and faster data.
2. Step 2: Understanding Symbols in TradingView

A symbol represents a trading instrument like a stock, forex pair, index, or cryptocurrency.
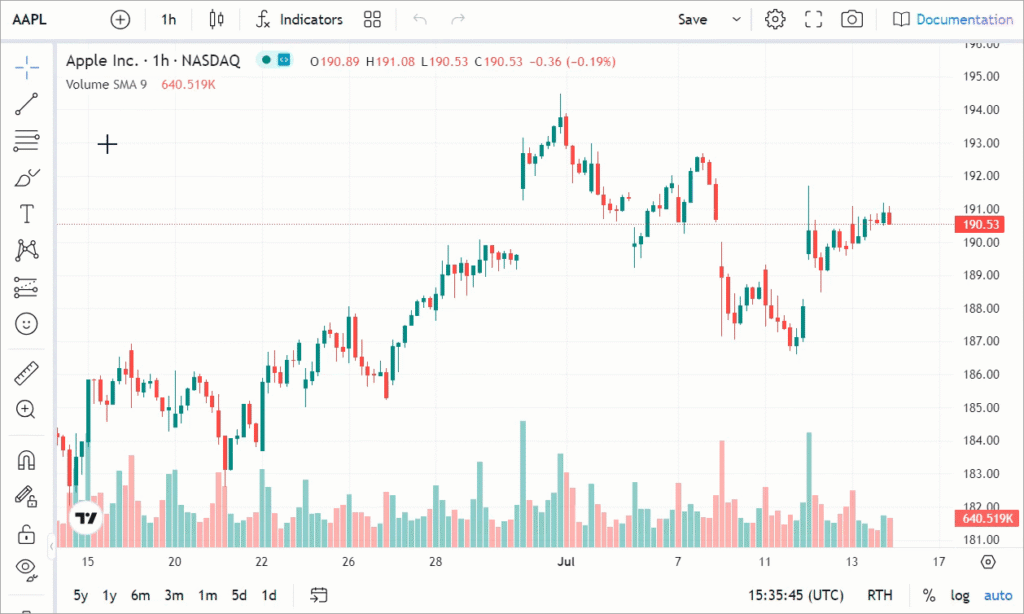
- At the top of your chart, you’ll see a symbol search bar.
- Type the name or ticker of the asset you want.
- Example: If you want Apple stock, type AAPL.
- For Bitcoin, type BTCUSD.
- For Reliance Industries (India), type RELIANCE.
Once you click on the symbol, the chart updates instantly.
Example: If you type EURUSD, the chart of Euro vs US Dollar appears, and you can start analyzing it.
3. Step 3: Adding Indicators to Symbols

After choosing a symbol, you may want to analyze it with indicators.
- Click on Indicators at the top.
- Search for an indicator, such as RSI (Relative Strength Index).
- Click it, and it will appear on your chart.
Example: If you are analyzing Tesla (TSLA) and want to check if it’s overbought, add RSI.
If RSI is above 70, it’s considered overbought.
4. Step 4: Using TradingView Screener

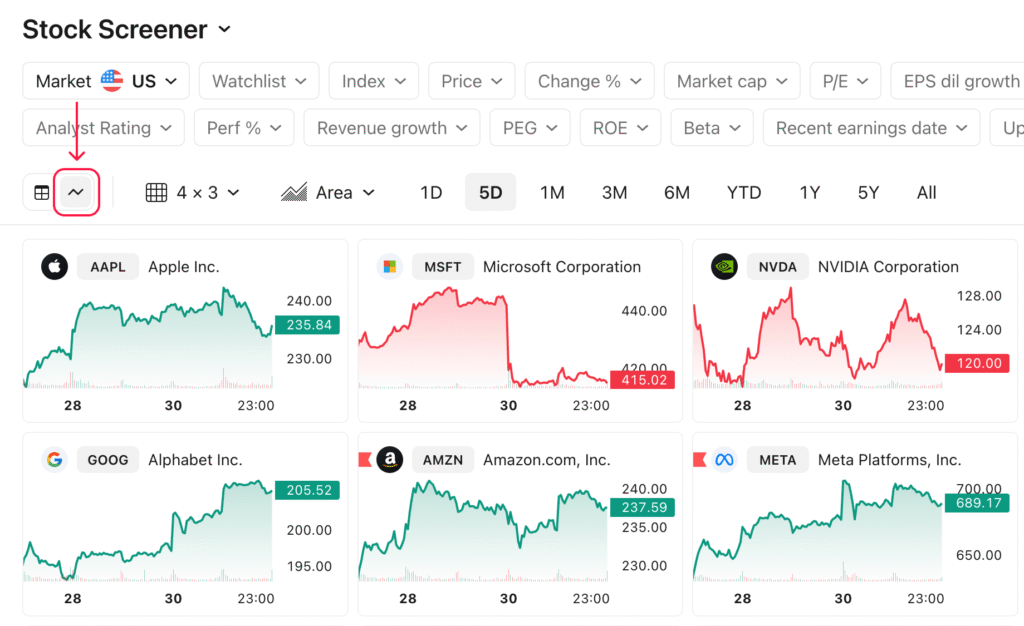
The Screener is one of the most powerful features in TradingView.
It helps you filter stocks, forex pairs, or crypto coins based on different conditions.
- At the bottom of the screen, click Stock Screener, Forex Screener, or Crypto Screener depending on what you trade.
- A table will open with a list of instruments and details like price, change %, volume, and technical ratings.
- You can filter based on conditions.
Example 1: Stock Screener
- Suppose you want stocks that are gaining today.
- In the Filters, choose Change % > 2%.
- Now you’ll see only stocks that are up more than 2%.
Example 2: Forex Screener
- Suppose you want strong currency pairs.
- In the Technical Rating column, choose Strong Buy.
- You’ll get a list of forex pairs with a bullish rating.
Example 3: Crypto Screener
- Suppose you want coins with high volume.
- In filters, select Volume > 1M.
- This will show cryptos actively traded in large numbers.
5. Step 5: Saving Your Layout in Tradingview

Once you customize your chart with symbols and indicators, you can save the layout.
- Click on the Cloud Save icon at the top.
- Name it (e.g., “My Forex Setup”).
- Next time you log in, you can load the same layout.
Example: If you trade both stocks and crypto, you can save two separate layouts—“Stocks Setup” and “Crypto Setup.”
6. Step 6: Practice and Explore Tradingview
TradingView has many other features like:
- Drawing tools (trendlines, Fibonacci retracement)
- Alerts (notify you when price reaches a level)
- Community ideas (see trade setups from other traders)
Example: If you want to know when Bitcoin crosses $100,000, you can set an alert.
TradingView will notify you by email or app notification.
7. Final Thoughts
TradingView is more than just a charting platform.
With simple registration, quick symbol search, and powerful screeners, it becomes an all-in-one tool for traders and investors.
- Registration helps you save your work.
- Symbols let you access any stock, forex, or crypto.
- Screener helps you find the best trading opportunities.
Start with the free plan, explore the features, and as you get comfortable, you can upgrade for more advanced tools.

Leave a Reply