
In Inner Circle Trader (ICT) methods, Fibonacci retracement and extension levels are used as a vital part of analyzing price movements and planning entries, particularly when anticipating areas where institutional traders might interact with price.
By applying the Fibonacci tool strategically, traders can identify key premium and discount zones for entries and exits, effectively aligning with the strategies of larger market players.
1. Understanding ICT Fibonacci Levels
In ICT trading, the Fibonacci tool is primarily used to identify retracement levels where price is likely to reverse or continue in the direction of a trend.
ICT traders often pay close attention to specific Fibonacci levels:
- 61.8% (Golden Ratio)
- 70.5%
- 79%
These levels are particularly relevant for spotting retracements or pullbacks that institutions may use to accumulate positions.
2. ICT-Focused Fibonacci Levels

ICT traders frequently employ the Fibonacci retracement tool from swing highs to swing lows (or vice versa) to anticipate entries at premium and discount levels:
- Premium Zone (Above 50%): This is a favorable area for sell positions when price retraces back into an uptrend.
- Discount Zone (Below 50%): This area is ideal for buy positions in a downtrend, as it offers a “discounted” entry point in the context of ICT.
For ICT, traders often focus on the 62% to 79% retracement levels when anticipating where “smart money” might engage with price.
3. How to Set Up Fibonacci Levels in ICT

To set up the Fibonacci levels in your charting tool:
- Identify the swing high and swing low of a recent price move.
- Draw the Fibonacci retracement from the swing high to the swing low for downtrends or vice versa for uptrends.
- Customize the Fibonacci tool to include ICT’s preferred levels:
- 0.0%, 50%, 61.8%, 70.5%, 79%, and 100%.
This setup allows you to see the premium and discount zones more clearly, as well as critical retracement levels that often coincide with institutional interest.
4. Examples of ICT Fibonacci Application

Example 1: Using Fibonacci Retracement for a Buy Entry in ICT
Suppose EUR/USD is in an uptrend, and price moves from a swing low of 1.2000 to a swing high of 1.2200 before retracing.
- Draw the Fibonacci from 1.2000 (low) to 1.2200 (high).
- The 61.8% level would be around 1.2112, 70.5% at 1.2089, and 79% at 1.2070.
In ICT, these levels represent zones where institutional traders may step in to buy, treating the retracement as a discount.
Once the price hits the 70.5% level and shows signs of support, an ICT trader might look for a buy signal, expecting the uptrend to continue from this discount zone.
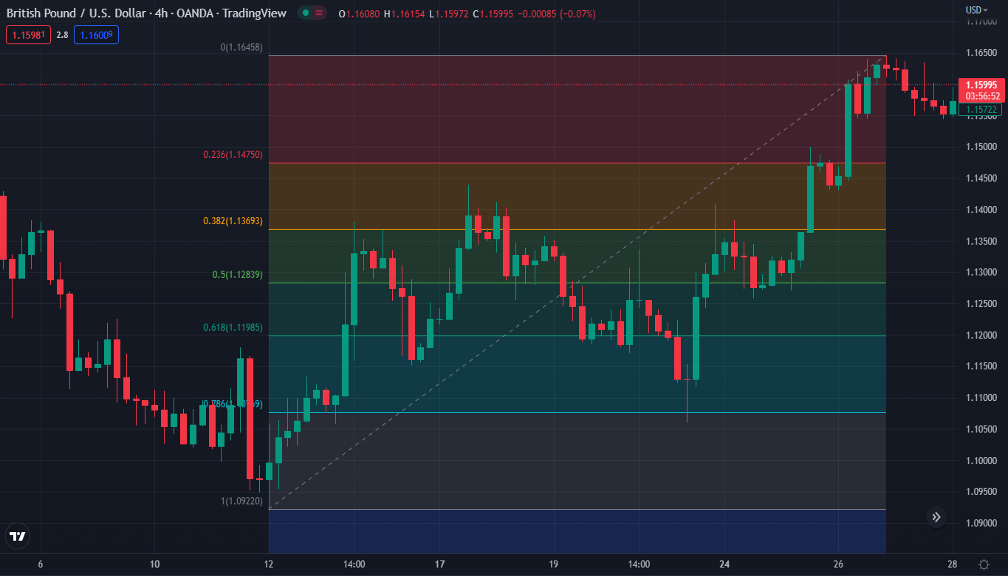
Example 2: Using Fibonacci Retracement for a Sell Entry in ICT
In a downtrend, GBP/USD moves from a swing high of 1.3600 to a swing low of 1.3400, and price begins to retrace.
- Draw the Fibonacci from 1.3600 (high) to 1.3400 (low).
- The 61.8% level would be around 1.3524, 70.5% at 1.3542, and 79% at 1.3558.
An ICT trader looking for a sell opportunity would observe price action at these levels.
If GBP/USD retraces to the 70.5% level and begins to stall, the trader might consider this an entry for a sell, aligning with the downtrend and anticipating that institutions will also treat this area as a premium zone.
5. Using Fibonacci Extensions in ICT
Fibonacci extensions, typically beyond the 100% level, help project potential targets.
ICT traders look at levels such as the 127.2% and 161.8% extensions as potential areas where price might exhaust a move.
Example 3: Setting Targets with Fibonacci Extensions in ICT
Assuming price has retraced to the 70.5% level and resumed its trend:
- For the EUR/USD uptrend example, set a Fibonacci extension from the swing low to the high, then back to the 70.5% retracement level.
- Potential targets could be at 127.2% and 161.8% extensions beyond the original high.
If the high was 1.2200, the 127.2% extension might land around 1.2264, and the 161.8% extension around 1.2320.
This method helps ICT traders anticipate areas where price might reach before retracing, allowing them to set profit-taking levels.
6. Why ICT Uses These Specific Levels
The emphasis on 61.8%, 70.5%, and 79% retracements in ICT isn’t arbitrary.
These levels align with historical data and institutional tendencies, reflecting areas where institutions have often entered or exited positions.
By anticipating these retracements, ICT traders align their entries and exits with larger market players, avoiding common retail mistakes like entering too early in a pullback or setting targets too close.
7. Summary of ICT Fibonacci Levels & Extensions
| Fibonacci Level | Purpose | Example (EUR/USD) |
|---|---|---|
| 61.8% | Golden retracement for reversals | 1.2112 in uptrend |
| 70.5% | Optimal entry in trend direction | 1.2089 as discount zone |
| 79% | Final level before potential reversal | 1.2070 in retracement |
| 127.2% & 161.8% | Targets for extended price moves | 1.2264 and 1.2320 in uptrend |
8. Conclusion
ICT’s use of Fibonacci levels provides a structured approach to identifying entry points, targets, and areas of reversal based on institutional behavior.
By focusing on the 61.8%, 70.5%, and 79% levels, traders can better align with where “smart money” might act, making the ICT Fibonacci strategy a powerful tool for anyone trading with a view to institutional alignment.
Leave a Reply