
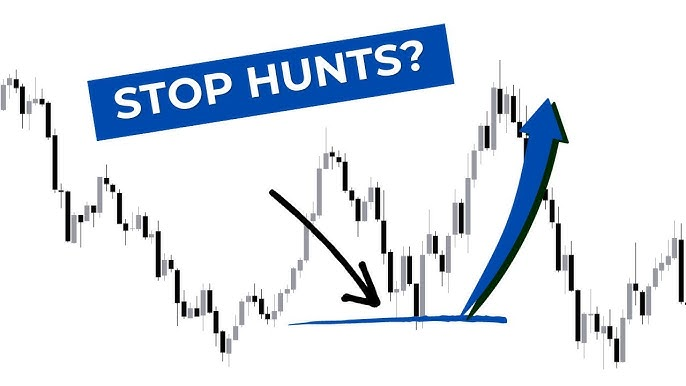
In Inner Circle Trader (ICT) trading, recognizing a potential stop hunt before it occurs can be a powerful way to avoid common retail traps and identify where institutional traders might drive prices to accumulate liquidity.
Stop hunts are strategic moves by institutional players to trigger stop-loss orders placed by retail traders, allowing them to enter the market with more liquidity.
By understanding these signs, ICT traders can align their entries with the moves of “smart money” and avoid falling into traps.
1. What Is a Stop Hunt in ICT?

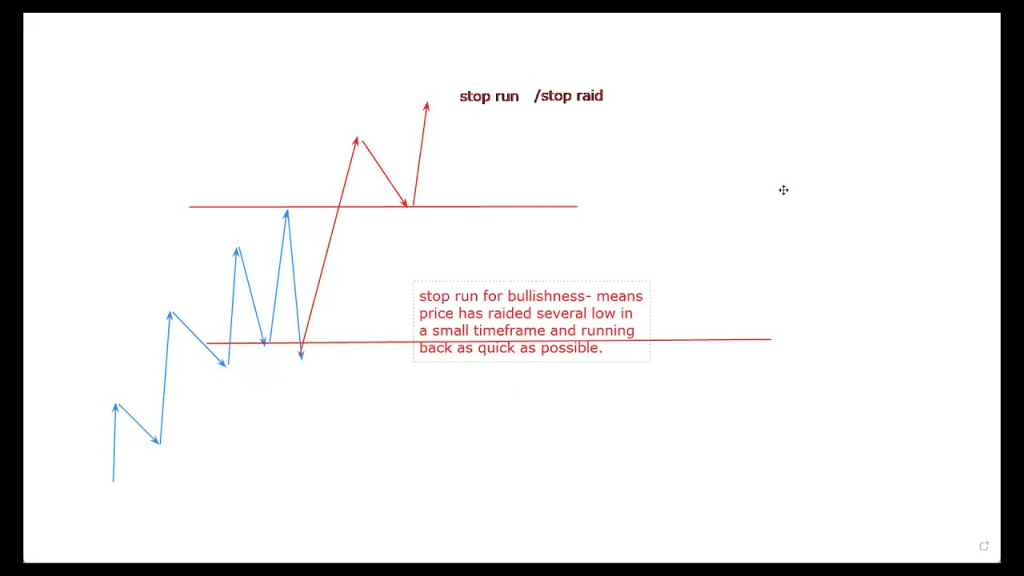
A stop hunt is a tactic where price temporarily moves to hit stop-loss orders placed by traders, typically near recent highs or lows.
The purpose is to capture liquidity by forcing retail traders out of their positions, creating the opportunity for institutional traders to take larger positions.
2. Recognizing Signs of a Potential Stop Hunt in ICT
A. Liquidity Pools Near Key Levels
One of the primary signs of an impending stop hunt is the presence of liquidity pools near major support or resistance levels.
Liquidity pools are areas where a large number of stop orders are likely gathered.
Example: In a strong uptrend, many traders will place their stop-loss orders just below recent swing lows.
This creates a liquidity pool that institutions may target, pushing the price momentarily below these lows to trigger those stops before reversing back in the trend’s direction.
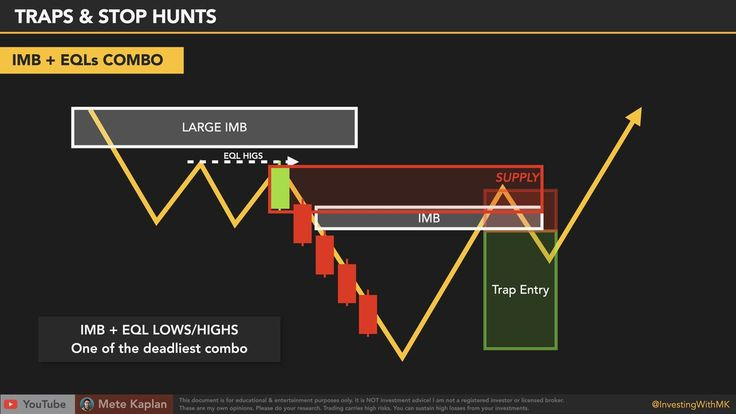
B. Sudden Price Consolidation Near Support/Resistance
When price consolidates near a key support or resistance level, it can indicate that a stop hunt is being prepared.
The market makers or institutions may be preparing to push through this level briefly to trap retail traders.
Example: If EUR/USD has been consolidating tightly near a key resistance level, retail traders may expect a breakout.
If institutions want to gather liquidity, they may push price above this level (stop hunting buy-side liquidity) and then quickly reverse it, trapping retail traders who expected a bullish breakout.
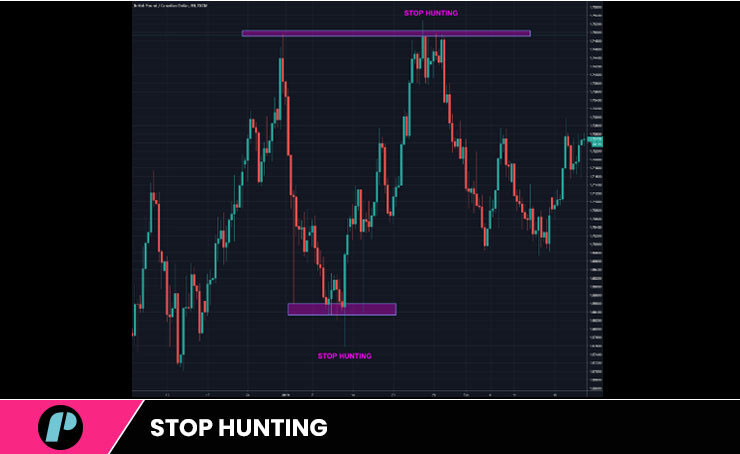
C. Previous Market Structure Highs or Lows
Institutions often target recent highs and lows because these are natural places for retail traders to place their stops.
Price reaching or approaching these levels is a sign that a stop hunt may happen, as institutions look to collect liquidity.
Example: In a downtrend, if price has made a recent low and then retraced, retail traders may place their stops just above the recent high.
When price moves back up and reaches that previous high, a brief stop hunt can occur, triggering those stops and collecting liquidity before resuming the downtrend.
D. Candlestick Patterns Indicating Exhaustion
Certain candlestick patterns can indicate an exhaustion in price movement that may signal a pending stop hunt.
For example, wicks extending beyond key levels can be signs of a potential stop hunt.
Example: In GBP/USD, if price moves sharply down to a support level and leaves a long wick below the level, it might indicate a stop hunt, as institutions have temporarily pushed price below to trigger stops and then quickly reversed back up, resuming the uptrend.
E. Volume Spikes on Breaks of Key Levels
Sharp increases in volume around support or resistance levels often signal a potential stop hunt.
When price nears a key level, a sudden volume spike can indicate institutional activity targeting retail stops.
Example: In a breakout attempt of a resistance level in the USD/JPY pair, if the breakout is accompanied by a large volume spike but quickly reverses, it suggests that institutions may have triggered buy stops (taking retail traders out of their positions) and are now reversing to continue the downtrend.
3. Examples of Stop Hunts in Action in ICT
1. Example 1: Bullish Stop Hunt in EUR/USD
Suppose EUR/USD has been in an uptrend and recently made a high at 1.2200 before retracing.
Retail traders may place their stop losses below a swing low at 1.2150.
If institutions want to accumulate buy orders, they may drive the price down to 1.2140, capturing stops below 1.2150, then reverse the price back up to resume the uptrend.
2. Example 2: Bearish Stop Hunt in GBP/USD
In a downtrend, GBP/USD retraces upward to a recent high at 1.3300.
Retail traders have stop orders set just above this high, expecting a downtrend continuation.
Institutions may push the price above 1.3300 briefly to trigger these stops, and then drive the price back down, resuming the downward movement.
4. Strategies to Avoid Getting Caught in Stop Hunts in ICT
1. Avoid Common Stop Placement Zones:
Place stops at less obvious levels instead of right above or below recent highs and lows.
2. Use Confirmation Signals:
Instead of entering immediately upon a breakout or breakdown, wait for confirmation (like a retracement or additional candlestick patterns) to confirm the direction.
3. Trade with Institutional Logic:
Recognize areas where liquidity might be high and avoid entering trades directly in those zones, as these are prime targets for stop hunts.
5. Practical Tips for Recognizing Stop Hunts in ICT
1. Watch for Key Psychological Levels:
Levels like 1.1000 or 1.2000 are often stop hunt targets.
2. Identify Market Session Overlaps:
During the London-New York session overlap, liquidity is higher, and stop hunts are more frequent as institutional players have greater market impact.
3. Observe Volume with Price Moves:
A sudden volume increase during a break of key levels could be a sign of institutional players driving a stop hunt.
6. Summary
| Stop Hunt Indicator | Description | Example |
|---|---|---|
| Liquidity Pools | Areas with clustered stop orders | Buy stops below recent lows, sell stops above recent highs |
| Price Consolidation | Tight price action near key support/resistance | Consolidation before a brief breakout and quick reversal |
| Highs/Lows of Structure | Targets for institutions due to natural stop placement | Price hits recent highs in a downtrend, reverses after triggering stops |
| Candlestick Exhaustion | Patterns like long wicks beyond key levels | Sharp downward wick below support, then price reverses |
| Volume Spikes | Increased volume on breaks of key levels | Volume spikes on breakout of resistance, then price reverses |
Recognizing these signs helps ICT traders avoid the retail traps set by smart money and, more importantly, leverage potential stop hunts for their benefit by entering after the institutional move has cleared weaker positions from the market.
Leave a Reply