

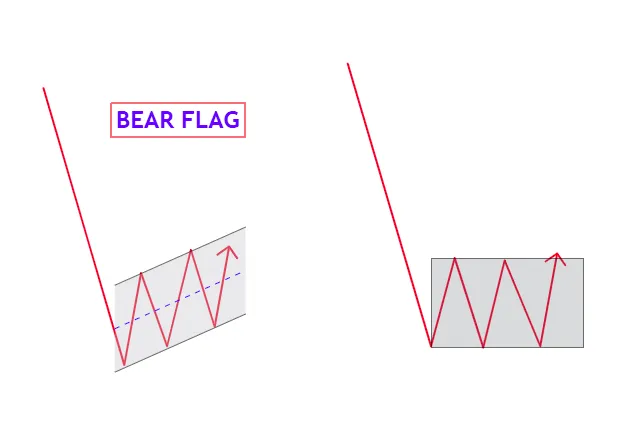
The Bear Flag Pattern is a continuation pattern that occurs during a downtrend, signaling the potential for further bearish price movement.
In ICT (Inner Circle Trader) trading, this pattern is analyzed alongside institutional trading concepts such as liquidity, order flow, and market structure, providing traders with a clear roadmap to enter trades.
1. Key Characteristics of the Bear Flag Pattern in ICT
1. Initial Impulse Move:
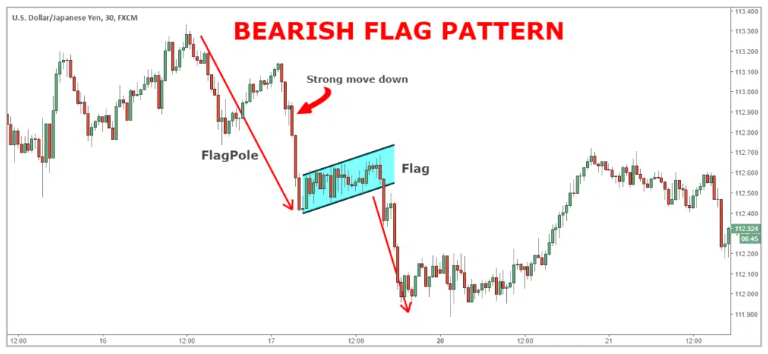
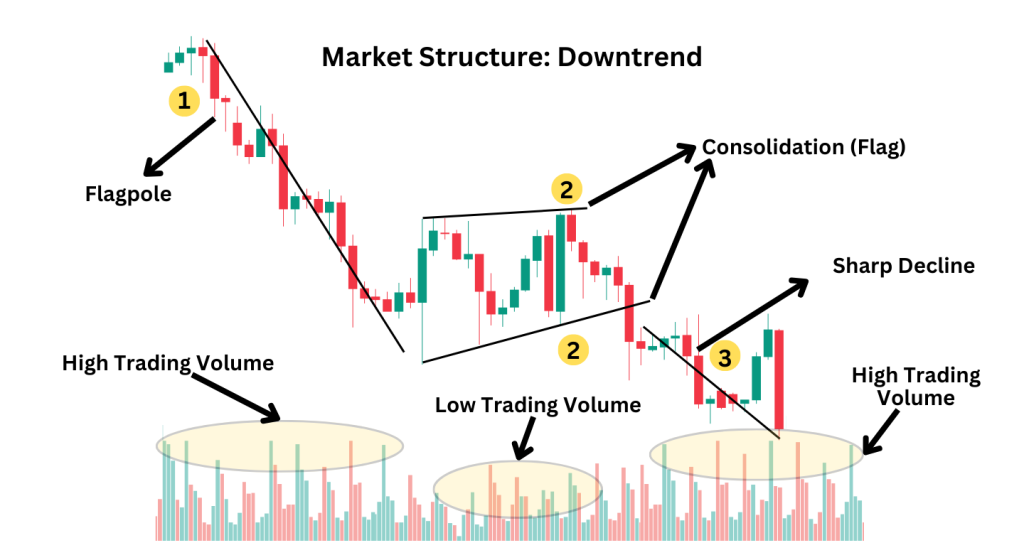
- A sharp downward price movement (flagpole) establishes bearish momentum.
- This move often results from smart money driving prices lower to capture liquidity or rebalance price.
2. Consolidation Phase:
- Price enters a temporary upward or sideways retracement, forming the “flag.”
- This phase is marked by lower volume and corrective price action.
3. Breakout:
- The pattern is completed when price breaks below the flag’s lower boundary, resuming the downtrend.
- This breakout often coincides with a liquidity sweep or displacement.
2. Bear Flag in ICT: Institutional Perspective
In ICT, the Bear Flag is not just a simple chart pattern but a reflection of institutional behavior:
- Liquidity Pools: The flag often forms near areas of liquidity, such as swing lows or order block levels.
- Smart Money Manipulation: Institutions may create the retracement to lure retail traders into premature bullish positions before driving prices lower.
3. How to Identify a Bear Flag in ICT
1. Spot the Flagpole:
Look for a strong bearish move (large, consecutive bearish candles) that breaks significant support levels.
2. Draw the Flag:
Identify the consolidation phase with trendlines, connecting the highs and lows of the retracement.
3. Confluence with ICT Concepts:
Check for fair value gaps (FVGs), order blocks, or liquidity voids within or near the flag.
Ensure the flag aligns with the broader bearish trend.
4. Trading the Bear Flag: Step-by-Step Guide
Example 1: Bear Flag on EUR/USD
1. Impulse Move:
EUR/USD drops sharply from 1.1200 to 1.1100, breaking below a key support level.
2. Consolidation:
Price retraces upward to 1.1130–1.1150, forming a flag pattern.
Within this zone, a bearish order block and a fair value gap are visible.
3. Breakout:
Price breaks below 1.1100 with a strong bearish displacement candle.
4. Trade Execution:
- Enter a short trade at 1.1100 (breakout level).
- Stop-loss: Above the flag at 1.1150.
- Target: 1.1000 (next liquidity level or extension of the flagpole length).
Example 2: Bear Flag on GBP/USD
1. Impulse Move:
GBP/USD drops from 1.2600 to 1.2500 due to a liquidity sweep.
2. Flag Formation:
- Price retraces to 1.2530, respecting the 62% Fibonacci retracement level.
- The flag forms near a previous bearish order block.
3. Breakout:
Price breaks below the flag’s lower boundary at 1.2500, resuming the downtrend.
4. Trade Execution:
- Enter a short position at 1.2500.
- Stop-loss: Above 1.2530 (flag high).
- Target: 1.2400 (equal to the length of the initial impulse move).
5. ICT Enhancements for Bear Flag Trading
1. Fair Value Gaps (FVGs):
Look for FVGs within the flag for precise entry points.
These gaps indicate price inefficiencies that institutions are likely to exploit.
2. Kill Zones:
Time entries during the London or New York Open when institutional activity is at its peak.
3. Liquidity Traps:
Ensure the flag forms near liquidity levels where institutions might sweep stops before the breakout.
4. Order Blocks:
Confirm the flag’s boundary aligns with a bearish order block for added confluence.
6. Advantages of the Bear Flag Pattern in ICT
1. Clear Risk-to-Reward Ratio:
The pattern offers well-defined entry, stop-loss, and target levels.
2. Confluence with ICT Concepts:
Combining the Bear Flag with liquidity and order flow analysis increases trade accuracy.
3. Trend Continuation:
Since it is a continuation pattern, it aligns with the broader market trend, improving success rates.
7. Common Mistakes to Avoid Trading Bear Flag Pattern
1. Entering Prematurely:
Wait for a confirmed breakout below the flag’s lower boundary before entering a trade.
2. Ignoring Context:
Avoid trading the Bear Flag if the market lacks a clear bearish trend.
3. Neglecting Confluence:
Combine the pattern with ICT tools like FVGs, order blocks, and kill zones for higher reliability.
8. Conclusion
The Bear Flag Pattern is a powerful continuation pattern in ICT trading when aligned with institutional concepts like liquidity sweeps, order blocks, and fair value gaps.
By understanding its structure and integrating it with smart money strategies, traders can enter high-probability trades during bearish trends.
This approach allows for precision, consistency, and improved profitability.
Leave a Reply