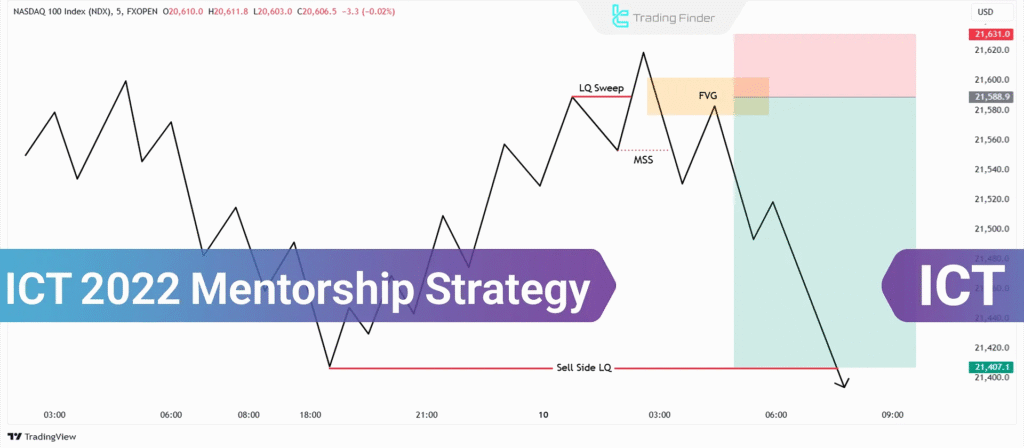
Michael Huddleston, also known as the Inner Circle Trader (ICT), shared one of his most practical and simplified trading strategies in the 2022 Mentorship.
This strategy is widely followed because it strips down all the ICT concepts into a step-by-step trading framework.
Instead of juggling too many tools, it focuses on the core elements of smart money trading: liquidity, market structure, and entry models.
1. The Core Idea of the ICT 2022 Mentorship Trading Strategy
The 2022 Mentorship strategy is built on three pillars:
- Daily Bias – Knowing whether to look for buys or sells.
- Liquidity Pools – Understanding where stops are resting (above highs or below lows).
- Entry Model – Using Fair Value Gaps (FVGs) after a liquidity sweep and market structure shift.
By combining these three, you get high-probability trades with excellent risk-to-reward ratios.
2. Step 1: Define the Daily Bias as per ICT
Before entering a trade, you must decide:
- Am I looking to buy today?
- Or am I looking to sell today?
ICT suggests using higher time frames like the Daily or 4H to set the bias.
Look for:
- If the market is bullish → focus on buying from discounted prices.
- If the market is bearish → focus on selling from premium prices.
Example:
If EURUSD is in a strong bullish trend on the Daily chart, your daily bias should be long.
This means you only look for buy setups intraday.
3. Step 2: Identify Liquidity Pools as per the ICT

Liquidity pools are areas where stop-losses are placed.
Institutions know this and drive the market into these levels to collect liquidity before moving price in the intended direction.
Look for:
- Relative Equal Highs/Lows – multiple highs or lows around the same level.
- Previous Day’s High/Low – common areas where liquidity is resting.
- Session High/Low – Asia session high/low often acts as a liquidity pool for London or New York.
Example:
If GBPUSD made equal highs at 1.2700, that’s a clear liquidity pool.
Smart money may push price above it to trap buyers, then reverse lower.
4. Step 3: Wait for Liquidity Sweep
Once you’ve marked the liquidity pools, wait for the market to sweep (take out) these levels.
- A sweep above liquidity means price goes higher, triggers buy stops, and then reverses down.
- A sweep below liquidity means price goes lower, triggers sell stops, and then reverses up.
This is the fake-out that creates the foundation for your entry.
Example:
Price trades below yesterday’s low, sweeps the sell stops, and then quickly reverses upward.
This gives you a bullish setup.
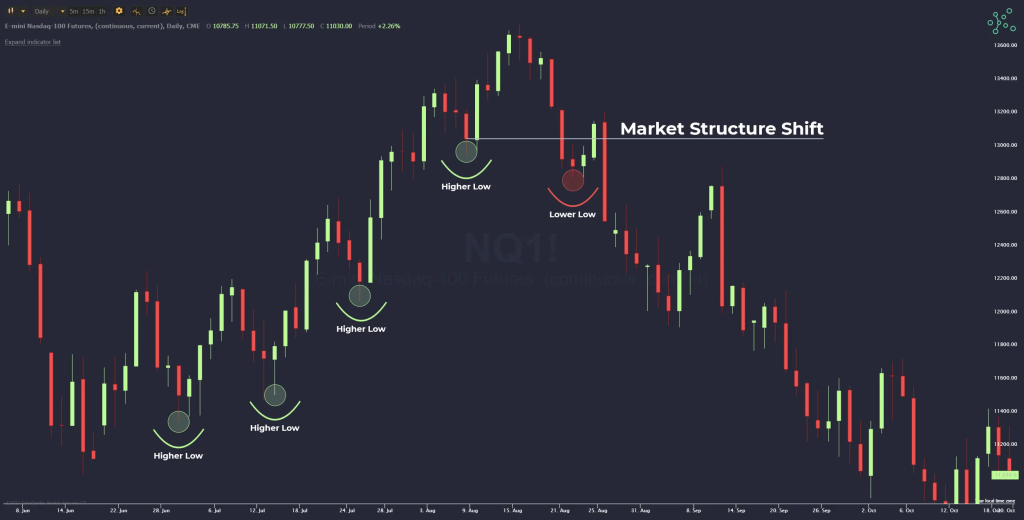
5. Step 4: Look for Market Structure Shift (MSS)

After the sweep, you don’t enter immediately. You wait for confirmation.
A Market Structure Shift (MSS) happens when:
- Price sweeps liquidity,
- Then breaks in the opposite direction, signaling a reversal.
Example:
On the 5-minute chart, price sweeps below the Asian low.
Instead of continuing down, it breaks above a short-term high.
That’s your bullish MSS.
6. Step 5: Entry in Fair Value Gap (FVG)

Once the MSS is confirmed, ICT looks for entry inside a Fair Value Gap (FVG).
An FVG is a small imbalance left behind when price moves too quickly in one direction, creating an “inefficient” gap between candles.
- In a bullish setup → wait for price to retrace into the bullish FVG, then buy.
- In a bearish setup → wait for price to retrace into the bearish FVG, then sell.
Example:
After a bullish MSS on EURUSD, you see a 5M bullish FVG.
Price retraces into it, and you enter long with stop-loss below the swept low.
7. Step 6: Risk Management as per ICT
Stop-loss placement is straightforward:
- For longs → place SL just below the swept low.
- For shorts → place SL just above the swept high.
Targets:
- Nearest liquidity pool (like previous day’s high/low, session high/low, or a big imbalance).
Example Trade:
- Entry: Long at 1.0850 after liquidity sweep.
- Stop-loss: 1.0835 (below sweep).
- Target: 1.0920 (previous day’s high).
That’s nearly 1:5 risk-to-reward.
8. Step 7: Session Timing
ICT emphasizes session timing because liquidity often shifts during specific times:
- London Open (2 AM – 5 AM EST) – Strong moves after Asia’s liquidity.
- New York Kill Zone (7 AM – 10 AM EST) – High probability reversals or continuations.
This helps filter trades and avoid low-probability setups.
9. Putting It All Together: ICT 2022 Mentorship Trading Strategy
The ICT 2022 Mentorship Strategy looks like this:
- Define daily bias (bullish or bearish).
- Identify liquidity pools.
- Wait for liquidity sweep.
- Confirm with Market Structure Shift.
- Enter on retracement into FVG.
- Manage risk with stops below/above sweep.
- Target next liquidity pool.
10. Example in Action for the ICT 2022 Mentorship Trading Strategy
Let’s say EURUSD is bullish on the Daily chart.
- Asia session makes a low at 1.0800.
- London session sweeps that low, pushing price to 1.0785.
- Price immediately bounces and breaks structure upward on the 5M chart (MSS).
- A bullish FVG forms at 1.0795–1.0805.
- You enter at 1.0800 with SL at 1.0780.
- Target is yesterday’s high at 1.0870.
This trade gives a 1:3+ RR with a clean ICT setup.
11. Final Thoughts
The ICT 2022 Mentorship Strategy is popular because it is simple, rule-based, and works consistently across Forex, indices, and even crypto.
By focusing only on liquidity, market structure, and FVG entries, traders can avoid over-complicating their analysis and stick to high-probability setups.
It’s a strategy built on institutional logic, making it one of the most powerful frameworks in ICT’s teachings.

Leave a Reply