
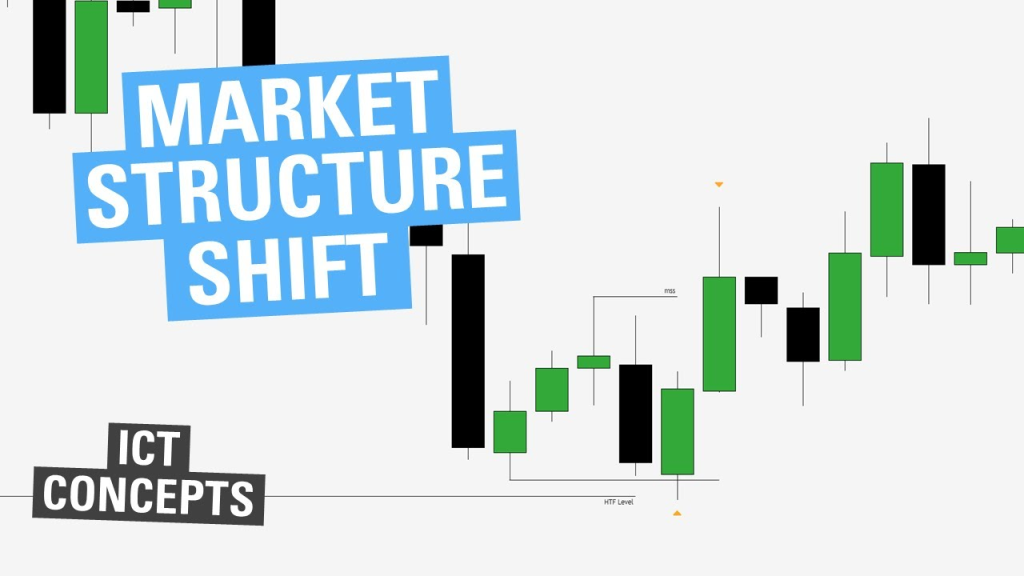
1. What is ICT Market Structure Shift (MSS)
In ICT (Inner Circle Trader) trading, a Market Structure Shift (MSS) occurs when price breaks a key structural level, signaling a potential trend reversal or strong momentum continuation.
It is a critical concept used by institutional traders to identify liquidity grabs, trend changes, and trade entry points.
MSS often aligns with Smart Money Concepts (SMC), including liquidity sweeps, order blocks (OBs), and fair value gaps (FVGs).
1. Break in Market Structure (BMS)
- A BMS occurs when price violates a previous high or low, showing strength in the opposite direction.
- Signals potential trend continuation.
2. Key Components of Market Structure Shift (MSS)
2. Change in Character (CHoCH)

- A CHoCH is an early warning sign of reversal.
- Confirms that institutions are shifting their positioning.
3. Liquidity Grab Before Shift
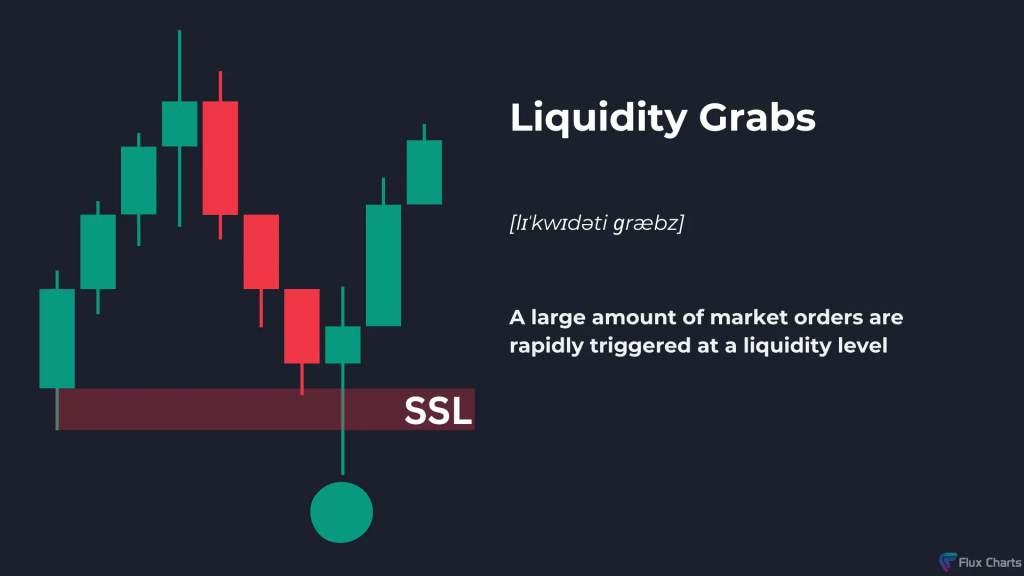
- Smart money induces liquidity hunts before shifting direction.
- Example: Stop-losses above previous highs are taken before a bearish MSS.
4. Order Blocks and Fair Value Gaps (FVGs) as Confirmation
- MSS is often followed by a retracement to an order block (OB).
- FVGs indicate strong momentum, confirming MSS.
3. Types of Market Structure Shifts (MSS) in ICT Trading
1. Bullish Market Structure Shift (Bullish MSS)
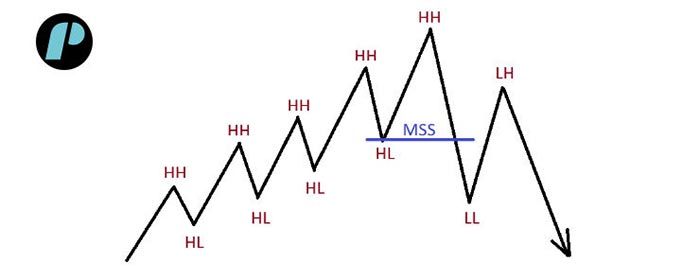
Occurs when price breaks a previous lower high (LH), signaling a shift from a downtrend to an uptrend.
Example: Bullish MSS in EUR/USD
- Price is in a downtrend (Lower Lows & Lower Highs).
- Liquidity Grab Below Previous Low: EUR/USD sweeps 1.0800 to stop out sellers.
- Strong Break Above Previous LH (1.0850) → MSS Confirmed.
- Price retraces to a Bullish Order Block at 1.0820 → Entry for Long Position.
- Price moves up to 1.0920, continuing the uptrend.
✅ MSS confirmed a shift from bearish to bullish structure.
2. Bearish Market Structure Shift (Bearish MSS)
Occurs when price breaks a previous higher low (HL), signaling a shift from an uptrend to a downtrend.
Example: Bearish MSS in GBP/USD
- Price is in an uptrend (Higher Highs & Higher Lows).
- Liquidity Grab Above Previous High: GBP/USD sweeps 1.2650 to stop out buyers.
- Strong Break Below Previous HL (1.2580) → MSS Confirmed.
- Price retraces to a Bearish Order Block at 1.2605 → Entry for Short Position.
- Price drops to 1.2500, continuing the downtrend.
✅ MSS confirmed a shift from bullish to bearish structure.
4. How to Identify Market Structure Shifts in Real Trading?
1. Look for Breaks of Key Highs/Lows
- If price breaks a previous low in an uptrend, it signals a bearish shift.
- If price breaks a previous high in a downtrend, it signals a bullish shift.
2. Identify Liquidity Grabs Before the Shift
- Institutions hunt stop-losses before shifting the trend.
- Example: If price is in a downtrend, a final liquidity sweep above a resistance level often precedes a bullish MSS.
3. Confirm with Order Blocks and Fair Value Gaps
- Order blocks act as support/resistance levels after MSS.
- FVGs show institutional momentum, confirming the structure shift.
4. Use Change in Character (CHoCH) for Early Signals
- CHoCH occurs before MSS and indicates a possible trend reversal.
- If CHoCH aligns with order flow and liquidity grabs, MSS is more reliable.
5. How to Trade Market Structure Shifts Using ICT Concepts?
1. Entering Trades After MSS Confirmation
- Bullish MSS: Buy after price retraces to a bullish OB or FVG.
- Bearish MSS: Sell after price retraces to a bearish OB or FVG.
📌 Example: Trading a Bullish MSS in NASDAQ (NAS100)
- NAS100 sweeps liquidity below 14,800 (stop-hunting sellers).
- Price breaks above 15,100 (previous LH) → MSS confirmed.
- Retracement to a Bullish OB at 14,950.
- Enter long position at 14,950, stop below 14,800.
- Target 15,400, next liquidity pool.
2. Stop-Loss and Take-Profit Strategies
- Stop-Loss (SL): Place below the liquidity grab level for bullish MSS and above liquidity grab level for bearish MSS.
- Take-Profit (TP): Target the next liquidity zone or FVG in the direction of MSS.
📌 Example: Trading a Bearish MSS in USD/JPY
- USD/JPY sweeps 150.00, trapping buyers.
- Price breaks below 149.00 → MSS confirmed.
- Retraces to a Bearish OB at 149.50 → Enter short trade.
- SL above 150.10, TP at 148.00.
6. Common Mistakes Traders Make When Identifying MSS
❌ Mistaking a Pullback for an MSS
- A pullback is NOT a market structure shift unless a key high/low is broken.
❌ Ignoring Liquidity Sweeps Before MSS
- Institutions manipulate price before shifting direction.
- Always check for stop-hunting moves before the MSS happens.
❌ Entering Trades Too Early
- MSS must be confirmed with retracement to OB or FVG.
- Wait for price to retest key areas before entering.
7. Conclusion: Why Market Structure Shift (MSS) is Critical in ICT Trading
✔ MSS is a key confirmation of trend reversals or momentum shifts.
✔ It follows a pattern of liquidity grab → break in structure → retracement → continuation.
✔ Combining MSS with Order Blocks and FVGs improves trade accuracy.
✔ Use Change in Character (CHoCH) as an early indicator of MSS.
✔ Always wait for a retracement before entering trades.
By mastering MSS, traders can align their trades with institutional order flow, improving entry precision and risk management in the forex and stock markets.
Leave a Reply