
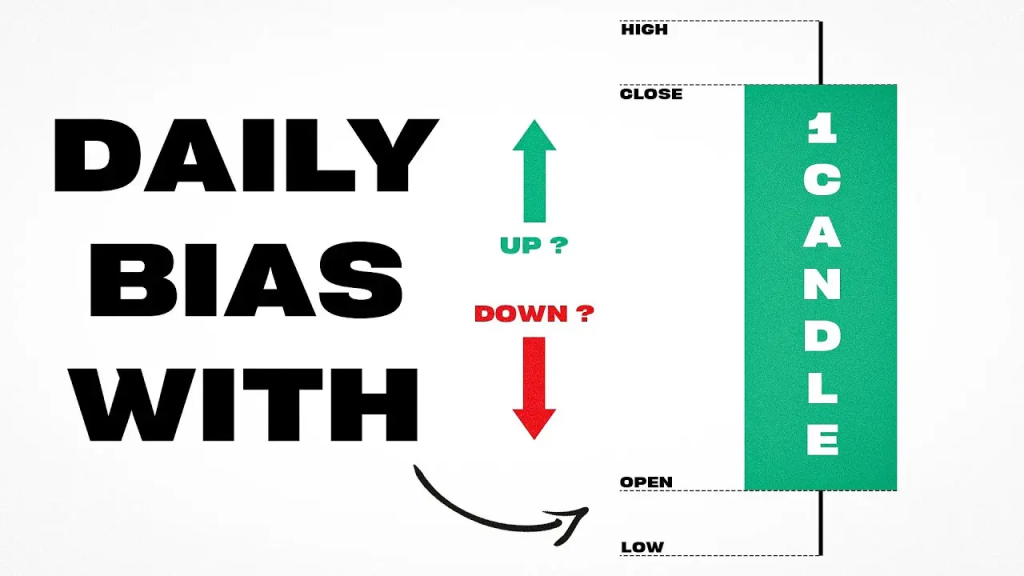
1. What is ICT Daily Bias?
ICT (Inner Circle Trader) Daily Bias refers to the anticipated directional movement of price for a given trading day.
It helps traders determine whether they should focus on buying (bullish bias) or selling (bearish bias) based on institutional order flow, liquidity, and market structure.
Understanding daily bias is critical because it aligns traders with smart money movements, improving trade precision and minimizing false signals.
2. Key Factors that Determine ICT Daily Bias
1. Higher Timeframe Market Structure
- Daily bias is derived from higher timeframe trends (Weekly, Daily, and 4H charts).
- Example: If the Weekly chart is bullish and the Daily chart is also making higher highs and higher lows, the daily bias is bullish.
2. Liquidity Pools (Buy-side & Sell-side Liquidity)
- Institutional traders target liquidity pools before moving price.
- Example: If price sweeps a key sell-side liquidity level and starts reversing upward, the daily bias becomes bullish.
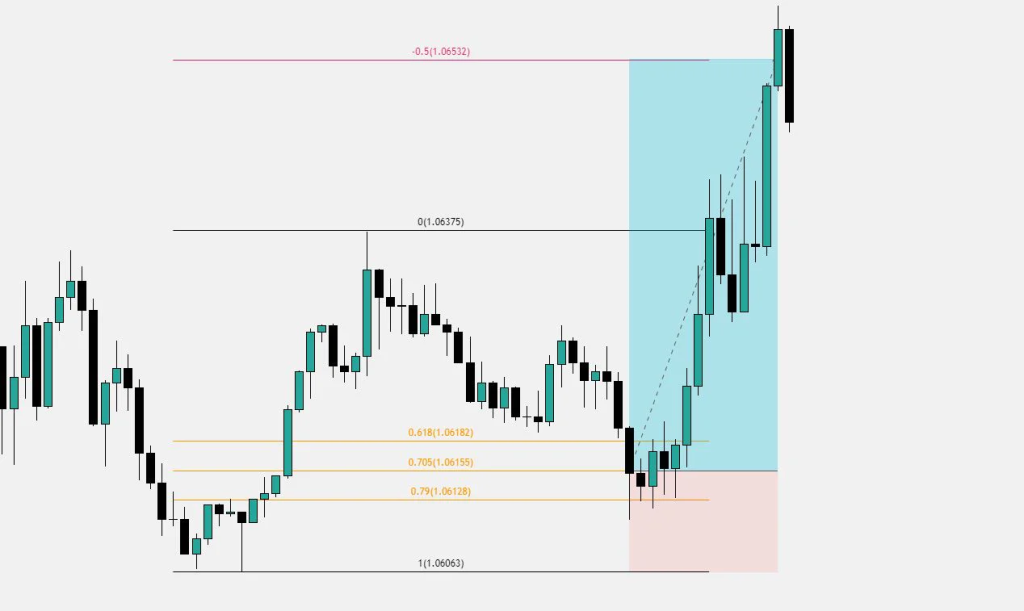
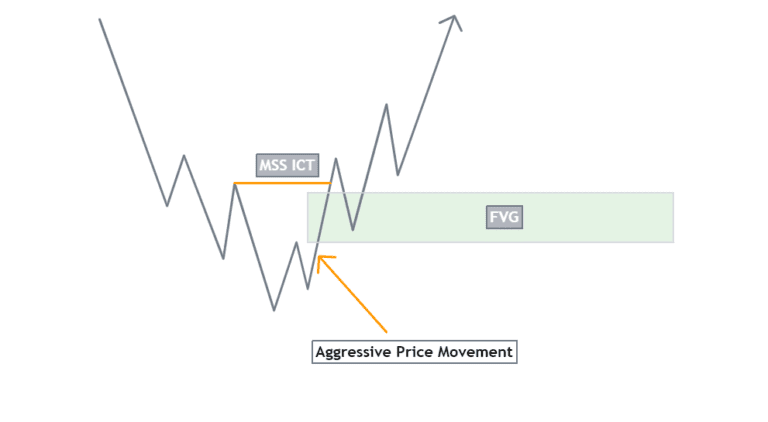
3. Order Blocks & Fair Value Gaps (FVGs)

- Price respects institutional order blocks to continue the trend.
- Example: If price is at a bullish order block on the Daily chart, it increases the chances of a bullish daily bias.
4. Kill Zones & Session Timings
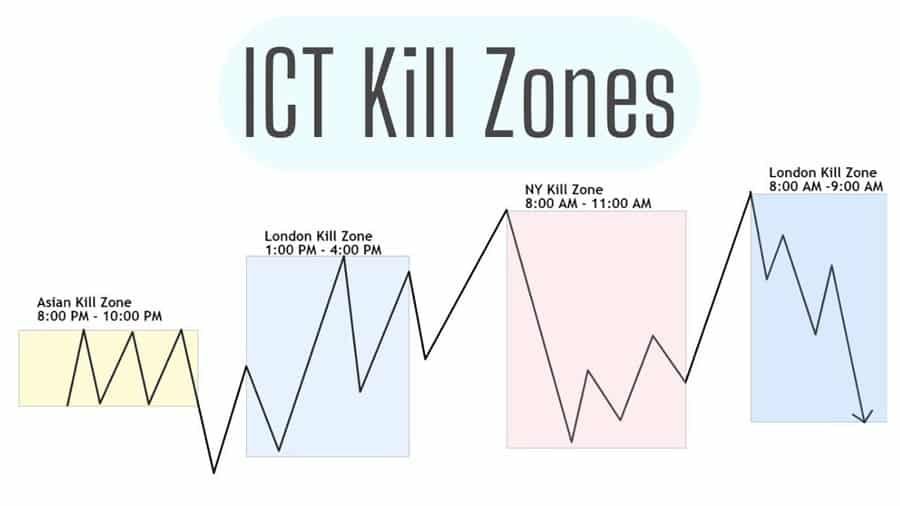
- London Open (2 AM – 5 AM EST) and New York Open (8 AM – 11 AM EST) define intraday directional moves.
- Example: If price drops during London Open but aggressively rises during New York Open, this confirms a bullish daily bias.
5. Economic News & Fundamentals
- High-impact news events (NFP, FOMC, CPI) can determine intraday sentiment.
- Example: If CPI data comes out weaker than expected, the USD weakens, leading to a bullish bias on EUR/USD.
3. Types of Daily Bias in ICT Trading
1. Bullish Daily Bias
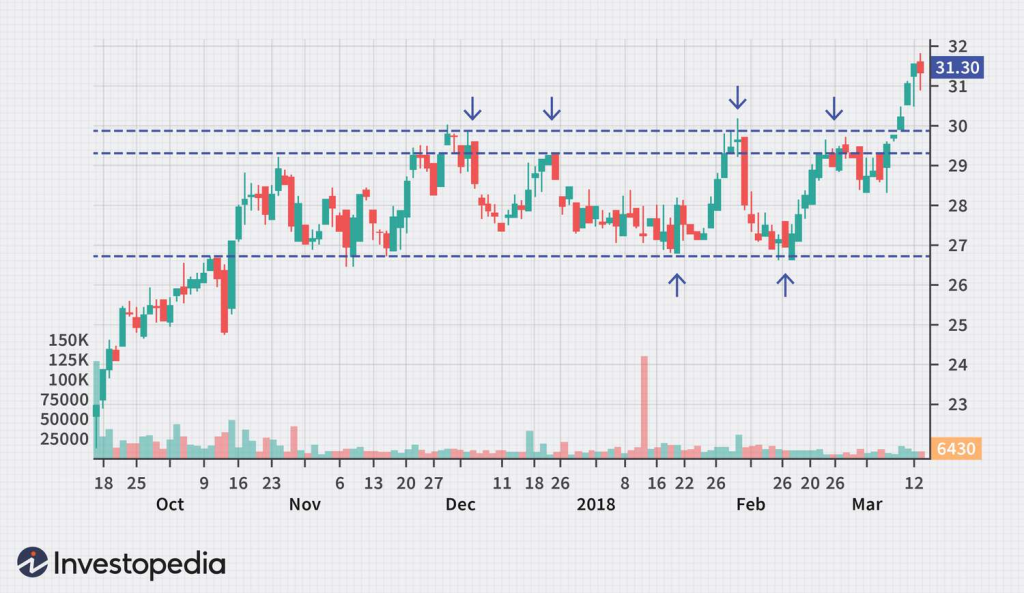
- Price is above key support zones and respecting bullish order flow.
- Liquidity has been taken from sell-side (liquidity grab before upward move).
- Order Blocks and FVGs are positioned for a bullish move.
Example: Bullish Bias in EUR/USD
- EUR/USD sweeps liquidity at 1.0800 (sell-side liquidity).
- Breaks structure above 1.0850 (higher high).
- Retraces to a bullish order block at 1.0820 → Buy setup.
- Price targets 1.0920 (buy-side liquidity).
✅ Daily bias was bullish, leading to high-probability buy trades.
2. Bearish Daily Bias
- Price is below key resistance zones, showing a bearish order flow.
- Liquidity has been taken from buy-side (stop-hunting long traders).
- Fair Value Gaps (FVGs) and Bearish Order Blocks confirm downward moves.
Example: Bearish Bias in GBP/USD
- GBP/USD sweeps liquidity above 1.2650 (buy-side liquidity trap).
- Breaks structure below 1.2580 (lower low).
- Retraces to a bearish order block at 1.2605 → Sell setup.
- Price drops to 1.2500 (sell-side liquidity).
✅ Daily bias was bearish, leading to successful short trades.
3. Neutral or Range-Bound Daily Bias
- No clear trend direction; price fluctuates within a range.
- Equal highs/lows indicate consolidation.
- Liquidity is accumulating before a major move.
Example: Neutral Bias in NAS100
- NAS100 is trading between 14,800 – 15,100 with no breakout.
- Liquidity is present on both buy-side and sell-side.
- Best strategy: Wait for a breakout OR fade the range at key liquidity zones.
📌 Neutral days are best for mean-reversion strategies rather than trend-following trades.
4. How to Determine ICT Daily Bias Step-by-Step
Step 1: Identify Market Structure on the Daily Chart
- Check if price is in a bullish trend (higher highs, higher lows) or bearish trend (lower highs, lower lows).
- If market structure is unclear, go to the 4H chart for more clarity.
Step 2: Find Liquidity Pools and Order Blocks
- Mark sell-side and buy-side liquidity zones.
- Identify if price is reacting to a bullish or bearish order block.
Step 3: Analyze the Previous Day’s High & Low
- The previous day’s high and low act as liquidity magnets.
- If price is sweeping yesterday’s low and reversing, today’s bias is likely bullish.
Step 4: Confirm with Fair Value Gaps (FVGs) and Kill Zones
- FVGs indicate strong institutional momentum in a direction.
- If price trades into an FVG and rejects, bias aligns with that move.
- Watch price action during London Open & New York Open for confirmation.
Step 5: Check Economic Events & News Releases
- Use Forex Factory or Investing.com to check for high-impact news.
- If major news aligns with technical bias, the move is likely to be strong.
5. Example: ICT Daily Bias Analysis in USD/JPY
1. Daily Chart Analysis
- Market structure: Bullish (higher highs, higher lows).
- Key liquidity zone: Buy-side liquidity at 150.50.
- Bullish order block at 149.80.
2. London Session: Liquidity Grab
- Price sweeps sell-side liquidity at 149.50, then aggressively moves up.
3. New York Open: Confirmation of Bias
- Price breaks previous high at 150.00, confirming bullish bias.
- Enters long trade at 149.80 (order block).
✅ Target: 150.50 liquidity pool → 70-pip profit.
6. Common Mistakes When Determining Daily Bias
❌ Ignoring Higher Timeframe Market Structure
- Always check Daily & 4H charts before deciding on the bias.
❌ Forcing Trades Against Smart Money Liquidity Moves
- If institutions are sweeping liquidity before reversing, wait for confirmation before entering.
❌ Not Factoring in High-Impact News Events
- Economic news can invalidate a technical bias, so always check the calendar.
7. Conclusion: Why ICT Daily Bias is Essential for Profitable Trading
✔ It aligns traders with institutional order flow, improving accuracy.
✔ Prevents counter-trend trading mistakes by focusing on liquidity.
✔ Combining MSS, Order Blocks, and FVGs strengthens bias confidence.
✔ Helps traders focus on high-probability trades during Kill Zones.
By following ICT Daily Bias principles, traders can increase consistency, reduce emotional trading, and maximize profitability in the forex and stock markets.
Leave a Reply