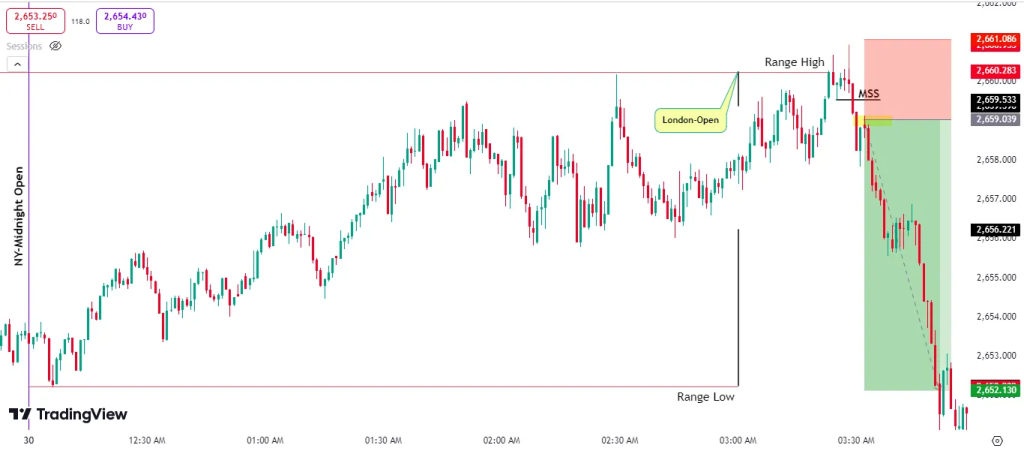
The ICT (Inner Circle Trader) trading model is a complete system to understand how price moves and how to trade in line with institutional activity.
If you want to master ICT, you need to know the core concepts and how they connect together.
Here’s a complete list of the most important ICT concepts – explained simply with examples.
1. Market Structure in ICT

Market structure shows the overall direction of the market.
It’s identified by swing highs and lows:
- Uptrend → Higher highs and higher lows
- Downtrend → Lower highs and lower lows
Example:
If EUR/USD breaks above the last swing high and keeps making new highs, it’s in an uptrend.
2. Liquidity in ICT

Liquidity is where stop-loss orders and pending orders are sitting in the market.
The market often moves to these zones before making the real move.
Types of liquidity:
- Buy-side liquidity → Above highs
- Sell-side liquidity → Below lows
Example:
If GBP/USD is hovering just below yesterday’s high, there’s buy-side liquidity above it.
Institutions may push price there to grab stops.
3. Fair Value Gap (FVG) in ICT

An FVG is an imbalance in price where the market moved too fast and left a gap between candles.
Price often comes back to fill it before continuing.
Example:
On a 15-min chart, you see a big bullish candle with almost no overlap with the previous candle’s wick. That’s a fair value gap – expect price to return to it.
4. Order Blocks in ICT

An order block is the last bullish or bearish candle before a big market move.
They represent institutional buying or selling zones.
Example:
If USD/JPY shoots up 100 pips after a small red candle, that red candle is the bullish order block.
5. Optimal Trade Entry (OTE) in ICT

The OTE is a specific retracement zone between 61.8% and 79% of a move, using the Fibonacci tool.
This is where smart money likes to enter trades.
Example:
Price rallies from 1.1000 to 1.1100. A retracement to around 1.1062 – 1.1080 can be an OTE buy zone.
6. Breaker Blocks in ICT
A breaker block is an order block that fails and becomes a reversal zone.
It often traps traders before reversing.
Example:
If a bearish order block is broken to the upside, it can act as bullish support when price comes back.
7. Market Structure Shift (MSS) in ICT

An MSS is when the trend changes.
It’s confirmed when a major swing high/low is broken and price starts making the opposite pattern.
Example:
EUR/USD making higher highs suddenly breaks the last low and forms lower highs – that’s an MSS to the downside.
8. Liquidity Void in ICT
A liquidity void is a fast price move with little resistance.
Price often retraces partially into it later.
Example:
A strong bullish candle without wicks means there’s a liquidity void that price might revisit.
9. Kill Zones in ICT

Kill zones are specific times of the trading day when volatility increases and smart money moves the market.
Main ICT kill zones:
- London Open (2 AM – 5 AM EST)
- New York Open (7 AM – 10 AM EST)
- New York PM (1 PM – 3 PM EST)
Example:
USD pairs often make big moves during the New York open kill zone.
10. Power of 3 (Accumulation – Manipulation – Distribution) in ICT
The market often moves in three stages:
- Accumulation – Sideways range
- Manipulation – False breakout to trap traders
- Distribution – The real move begins
Example:
On a daily chart, price stays flat for days (accumulation), spikes down (manipulation), then rallies strongly (distribution).
11. Judas Swing in ICT
The Judas Swing is the false move in the opposite direction before the real move.
Example:
In the London session, GBP/USD may drop quickly for 15–30 minutes (Judas swing) before reversing and going up for the rest of the session.
12. Seek and Destroy Setup in ICT
This is when the market targets both sides of liquidity in a range before closing back inside.
Example:
On Friday, EUR/USD breaks the week’s high, then drops and breaks the low, ending the day back in the middle.
13. Final Thoughts
ICT concepts aren’t random tricks – they are a map of how institutional traders move the market.
The key is to practice spotting these patterns on charts daily until they become second nature.
Once you understand them, you can trade with the smart money, not against it.

Leave a Reply