
The ICT Market Maker Sell Model (MMSM) is a concept developed within the Inner Circle Trader (ICT) framework.
This model outlines how market makers or large institutional players manipulate price action to create liquidity, execute sell-side operations, and induce retail traders to participate in the market on the wrong side of the trend.
Understanding this model helps traders align with institutional moves and avoid being trapped.
1. Key Components of the ICT Market Maker Sell Model
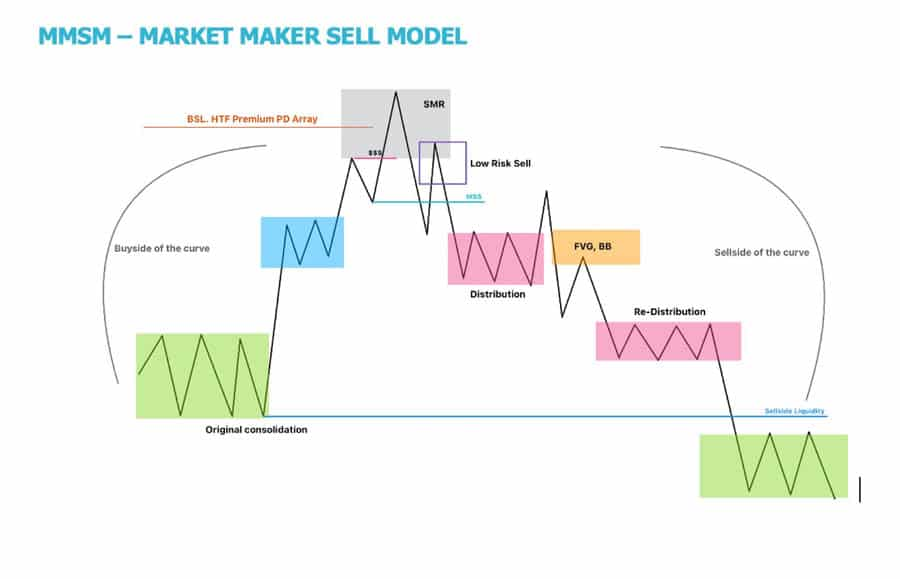
1. Accumulation Phase:
- This is the phase where market makers accumulate short positions.
- Price often consolidates within a range as liquidity builds up above and below the consolidation zone.
- Retail traders are enticed to place stop-loss orders around these levels.
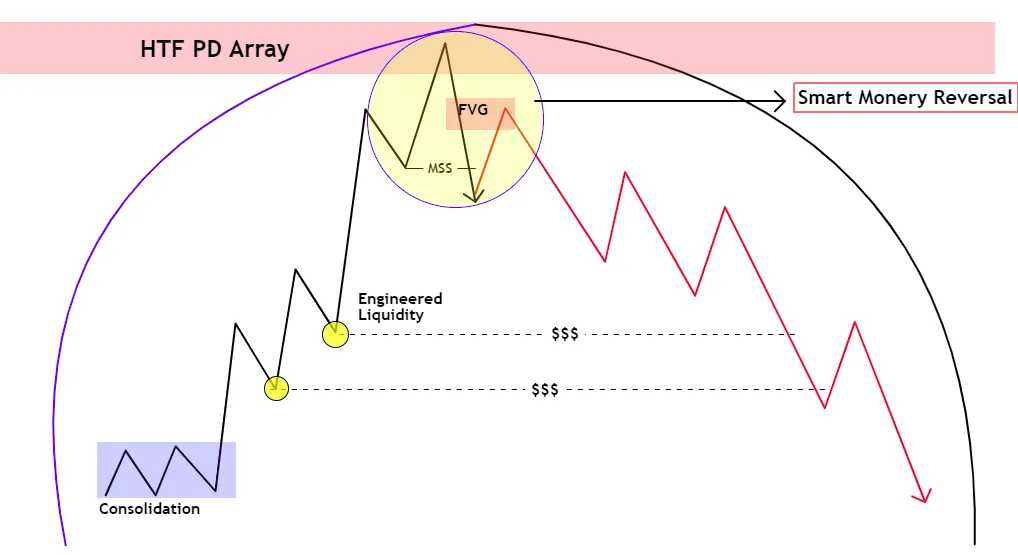
2. Liquidity Sweep:
- Market makers engineer a move to sweep liquidity from one side of the range, typically targeting the buy-side liquidity above swing highs.
- This creates the illusion of a breakout, drawing retail traders into long positions.
3. Displacement Move:
- Following the liquidity sweep, price reverses sharply in the opposite direction, creating a strong bearish displacement.
- This move signals the start of a sell-off as market makers execute their short positions.
4. Distribution Phase:
During this phase, price retraces into premium zones, such as Fair Value Gaps (FVGs) or Order Blocks (OBs), allowing market makers to distribute short positions at higher prices.
5. Continuation to the Downside:
After the retracement, price resumes its bearish trend, targeting liquidity below the range or previous swing lows.
2. Steps to Identify and Trade the ICT Market Maker Sell Model
1. Identify Consolidation:
Look for a range where price is moving sideways, often characterized by multiple equal highs and lows.
2. Wait for Liquidity Sweep:
- Observe for a sharp move above the range (buy-side liquidity sweep).
- Confirm this as a trap by monitoring the immediate rejection.
3. Spot Displacement:
Look for a strong bearish candle or series of candles that break the range to the downside, leaving an FVG or imbalance.
4. Mark Retracement Zones:
Use ICT tools like FVGs, Order Blocks, or Fibonacci levels to identify retracement zones for potential short entries.
5. Enter the Trade:
Enter at the retracement zone with a stop-loss above the liquidity sweep or order block.
6. Set Targets:
Target liquidity pools below the range or previous swing lows.
3. Examples of ICT Market Maker Sell Model
Example 1: EUR/USD on a 1-Hour Chart
- Accumulation Phase: Price consolidates between 1.1200 and 1.1230 for several hours, forming equal highs and lows.
- Liquidity Sweep: During the London Open, price spikes to 1.1240, sweeping buy-side liquidity above equal highs.
- Displacement Move: A strong bearish candle breaks the range to the downside, leaving an FVG between 1.1220–1.1210.
- Retracement Zone: Price retraces to the FVG at 1.1215.
- Trade Entry: Short entry at 1.1215 with a stop-loss at 1.1245 and a target at 1.1180 (liquidity pool below the range).
- Outcome: Price resumes its bearish trend, hitting the target.
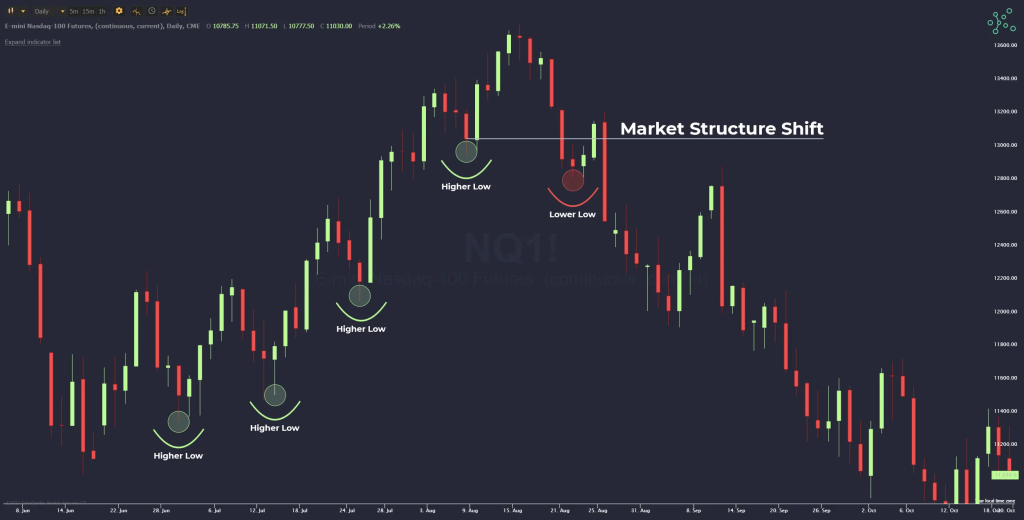
Example 2: NASDAQ Index on a 15-Minute Chart
- Accumulation Phase: The market consolidates between 15,500 and 15,550 during the Asian session.
- Liquidity Sweep: A sudden spike to 15,570 sweeps buy-side liquidity during the New York Open.
- Displacement Move: Price reverses sharply, leaving a bearish FVG and breaking below 15,500.
- Retracement Zone: Price retraces to the FVG near 15,520.
- Trade Entry: Short entry at 15,520 with a stop-loss at 15,580 and a target at 15,400 (previous swing low).
- Outcome: The market sells off, reaching the target.
Example 3: Gold (XAU/USD) on a 4-Hour Chart
- Accumulation Phase: Gold consolidates between $1,950 and $1,975, forming equal highs and lows.
- Liquidity Sweep: During the London session, price spikes to $1,980, sweeping liquidity above the range.
- Displacement Move: A strong bearish move breaks below $1,950, creating a bearish imbalance.
- Retracement Zone: Price retraces to $1,960, where a bearish order block aligns with the FVG.
- Trade Entry: Short entry at $1,960 with a stop-loss at $1,985 and a target at $1,920 (next liquidity pool).
- Outcome: Price continues lower, achieving the target.
4. Key Learnings from the ICT Market Maker Sell Model
1. Market Maker Intent:
- Market makers target liquidity above or below obvious levels to fill their orders.
- Understanding their intent helps traders avoid being trapped.
2. Use ICT Tools:
- Combine order blocks, FVGs, and liquidity concepts to confirm entries and exits.
- Align trades with killzones for better precision.
3. Risk Management:
- Place stop-losses beyond liquidity sweeps or key levels.
- Use proper position sizing to manage risk.
5. Conclusion
The ICT Market Maker Sell Model provides a clear framework for understanding institutional sell-side activity.
By mastering this model, traders can align with smart money moves, improving trade precision and profitability.
Practice identifying these setups in historical data and live markets to build confidence and consistency.
Leave a Reply