
The Inner Circle Trader (ICT) methodology is widely recognized for providing a structured approach to understanding institutional trading.
The following case studies highlight real-world examples of ICT strategies, including the use of order blocks, fair value gaps (FVGs), killzones, and liquidity concepts.
These examples aim to demonstrate how ICT principles are applied in different market scenarios.
Case Study 1: Order Block Rejection During London Open
Market: GBP/USD
Scenario: The market is in an uptrend with price making higher highs and higher lows.
Objective: Identify a continuation trade using a bullish order block during a killzone.
Analysis:
- Daily Bias: Bullish, based on the higher time-frame structure.
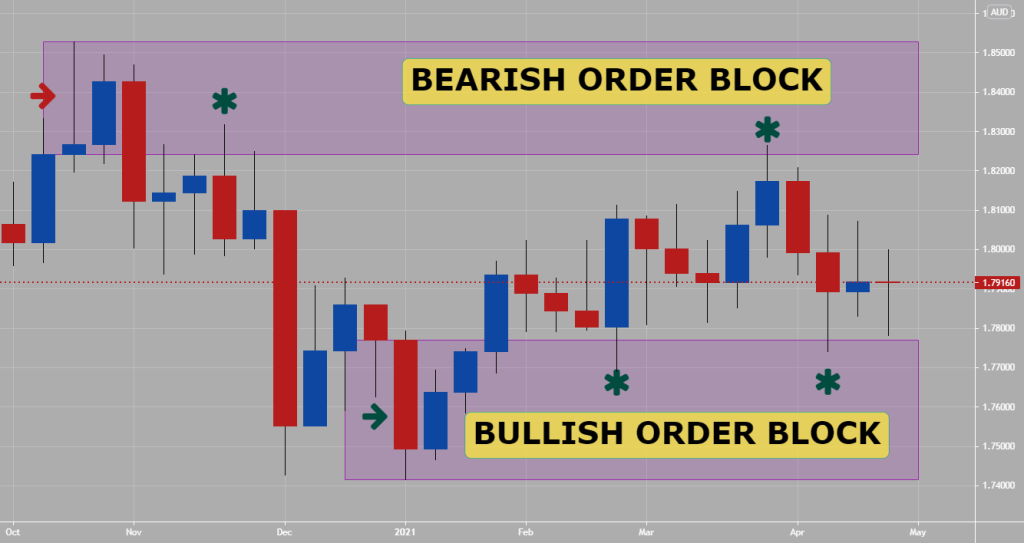
- Order Block Identification: A bullish order block forms at 1.2700–1.2720 on the 1-hour chart after a strong rally.
- Killzone: London Open (2:00–5:00 AM EST).
Execution:
- Price retraces during the Asian session, reaching the bullish order block.
- During the London Open, price tests the order block and forms a bullish pin bar.
- Entry is taken at 1.2725 with a stop-loss at 1.2695 (below the order block).
- Target is set at the previous swing high at 1.2800.
Outcome:
- Price rallies during the London session, respecting the order block and hitting the target.
- Risk-to-reward ratio: 2.5:1.
Key Learnings:
- Combining order blocks with killzones increases trade precision.
- Bullish rejection candles confirm institutional activity.
Case Study 2: Liquidity Sweep Followed by Trend Continuation
Market: NASDAQ Index
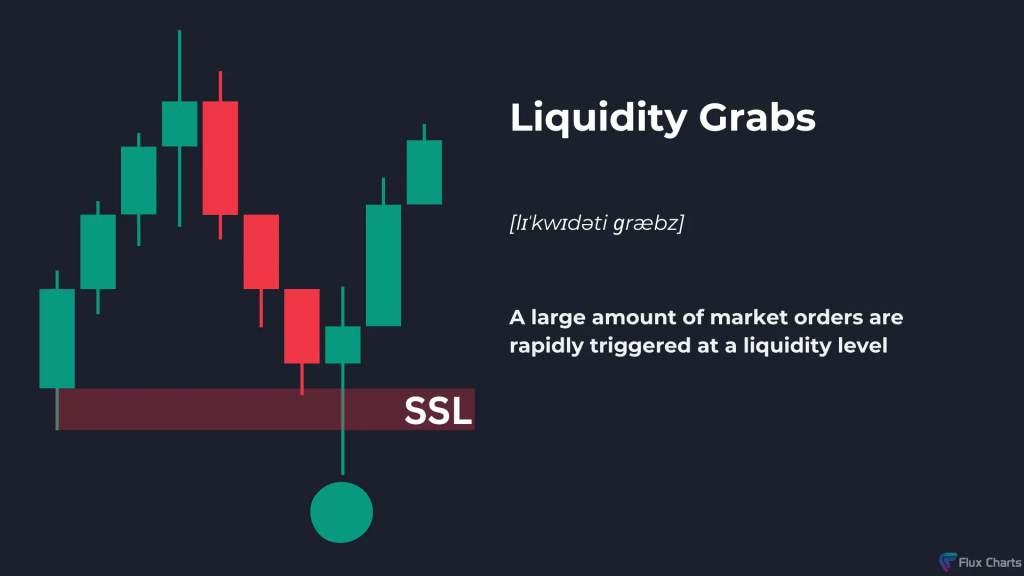
Scenario: The market is in a strong uptrend. A liquidity sweep occurs at a previous swing low.
Objective: Trade the continuation after the liquidity sweep.
Analysis:
- Bias: Bullish, supported by higher time-frame trends.
- Liquidity Pool: A swing low at 14,800 on the 1-hour chart.
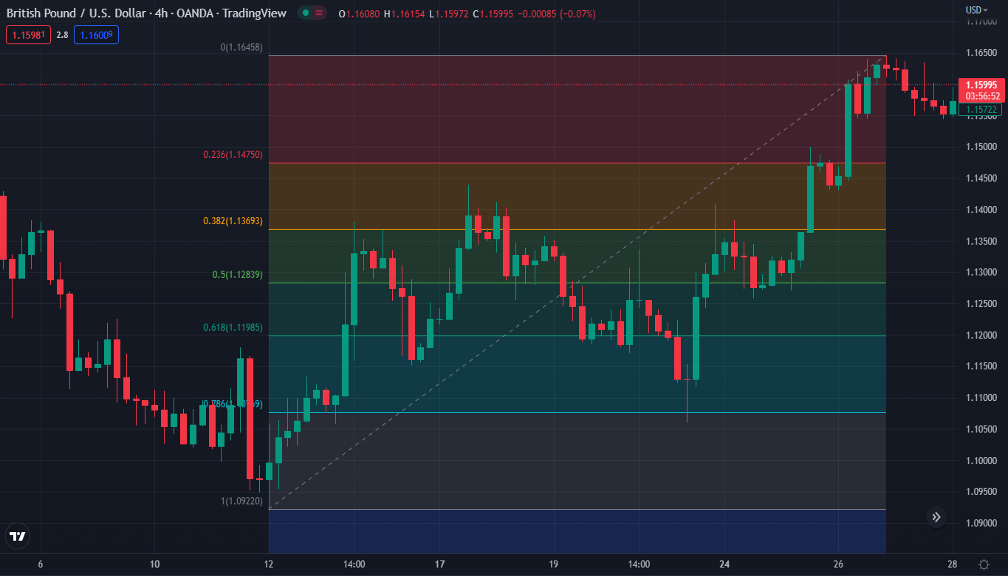
- FVG: A fair value gap aligns with the 50% Fibonacci retracement.
Execution:
- Price sweeps the liquidity at 14,800 during the New York Open killzone.
- Price forms a bullish engulfing candle, filling the FVG and rejecting the liquidity sweep.
- Entry is taken at 14,850 with a stop-loss at 14,780 (below the liquidity sweep).
- Target is set at 15,200 (previous swing high).
Outcome:
- Price resumes the uptrend and hits the target during the same session.
- Risk-to-reward ratio: 5:1.
Key Learnings:
- Liquidity sweeps often signal smart money re-entering the market.
- Combining FVGs with liquidity sweeps enhances trade setups.
Case Study 3: Fair Value Gap Fill During New York Open

Market: EUR/USD
Scenario: A sharp bearish move creates a fair value gap on the 15-minute chart.
Objective: Enter a trade as price fills the FVG and resumes the downtrend.
Analysis:
- Bias: Bearish, as indicated by lower lows and lower highs.
- FVG Location: Between 1.0800 and 1.0820 on the 15-minute chart.
- Killzone: New York Open (8:00–11:00 AM EST).
Execution:
- Price retraces to fill the FVG at 1.0815 during the New York Open.
- A bearish rejection candle forms, signaling continuation.
- Entry is taken at 1.0810 with a stop-loss at 1.0830 (above the FVG).
- Target is set at 1.0750 (previous liquidity pool).
Outcome:
- Price rejects the FVG and continues lower, hitting the target.
- Risk-to-reward ratio: 3:1.
Key Learnings:
- Fair value gaps act as magnets for price during retracements.
- Timing trades in killzones improves success rates.
Case Study 4: Using ICT Fibonacci Levels for Entry
Market: Gold (XAU/USD)
Scenario: A strong bullish rally retraces to a Fibonacci level.
Objective: Trade the continuation using ICT Fibonacci and confluences.
Analysis:
- Bias: Bullish based on a daily uptrend.
- Fibonacci Levels: The 61.8% level aligns with a bullish order block at $1,920.
Execution:
- Price retraces to the 61.8% Fibonacci level at $1,920.
- During the London Close killzone, price forms a bullish engulfing candle.
- Entry is taken at $1,922 with a stop-loss at $1,910 (below the order block).
- Target is set at $1,960 (previous swing high).
Outcome:
- Price rallies, respecting the Fibonacci level and reaching the target.
- Risk-to-reward ratio: 4:1.
Key Learnings:
- Fibonacci levels provide reliable continuation points when combined with other ICT tools.
- Aligning entries with killzones enhances precision.
Case Study 5: Stop Hunt and Reversal

Market: USD/JPY
Scenario: A stop hunt occurs above a previous high during the Asian session.
Objective: Trade the reversal following the stop hunt.
Analysis:
- Bias: Bearish based on lower time-frame structure.
- Liquidity Pool: A swing high at 140.50.
Execution:
- During the Asian session, price spikes above 140.50, sweeping liquidity.
- A bearish engulfing candle forms during the London Open, confirming the reversal.
- Entry is taken at 140.40 with a stop-loss at 140.60 (above the stop hunt).
- Target is set at 139.80 (previous swing low).
Outcome:
- Price reverses sharply, hitting the target.
- Risk-to-reward ratio: 3:1.
Key Learnings:
- Stop hunts provide excellent reversal opportunities when paired with killzones.
- Look for confirmation candles before entering.
Final Thoughts
ICT strategies provide a systematic framework for trading based on institutional activity.
These case studies illustrate how tools like order blocks, FVGs, killzones, and liquidity sweeps can be combined to identify high-probability setups.
By practicing these strategies on historical data, traders can refine their skills and apply them effectively in live markets.
Leave a Reply