
In the Inner Circle Trader (ICT) methodology, SIBI (Sell-side Imbalance, Buy-side Inefficiency) and BISI (Buy-side Imbalance, Sell-side Inefficiency) are crucial concepts that represent price imbalances.
These imbalances occur when there’s an unequal distribution of buy and sell orders, typically due to aggressive institutional trading, creating gaps or inefficiencies in price movement.
Understanding and using these imbalances can help traders anticipate future price behavior.
1. What is SIBI in ICT?
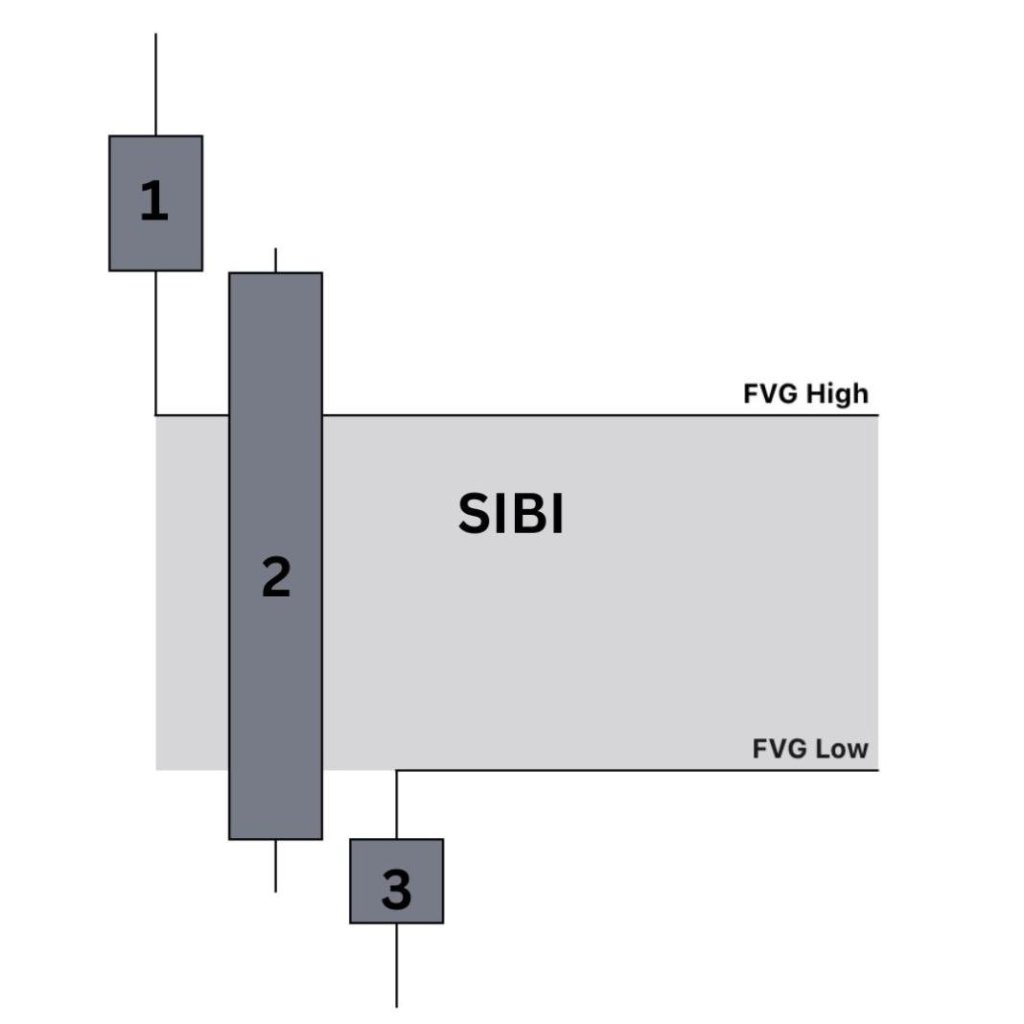
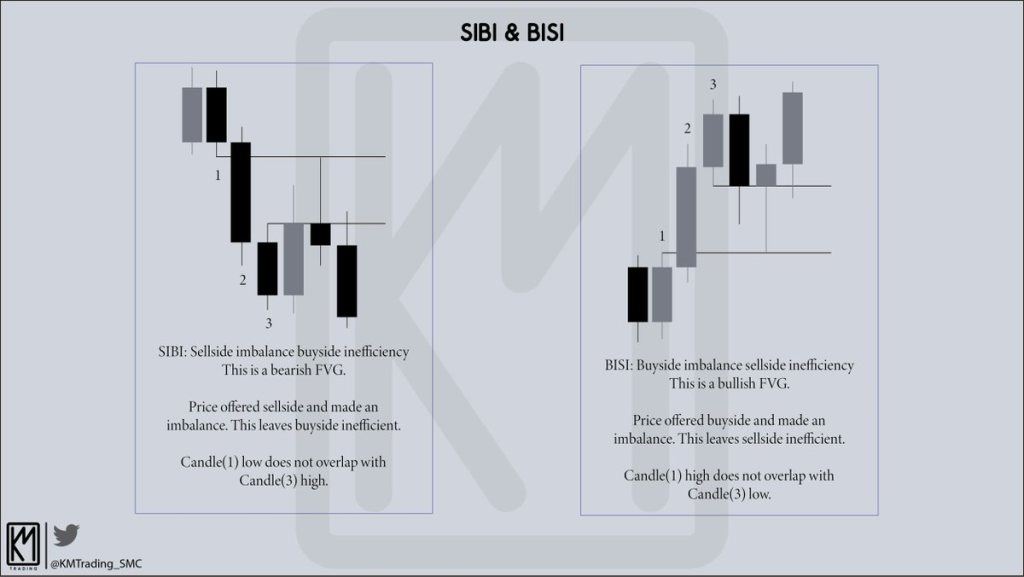
1. SIBI (Sell-side Imbalance, Buy-side Inefficiency):
- Occurs when there is an aggressive sell-off in the market, leaving little or no opportunity for buyers to enter.
- Appears as a one-sided price movement, creating a gap or imbalance on the chart.
- Signals a potential area of interest for future price retracement, as institutions may revisit the imbalance to fill unexecuted buy orders.
2. Visual Representation:
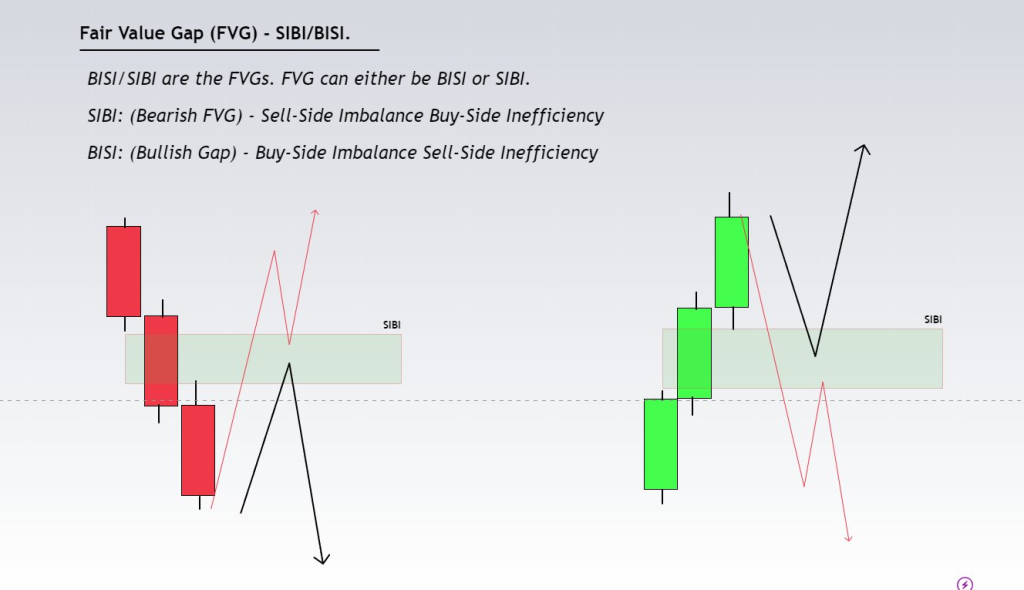
On a candlestick chart, SIBI is characterized by a series of bearish candles with little or no overlap between their highs and lows.
2. What is BISI in ICT?
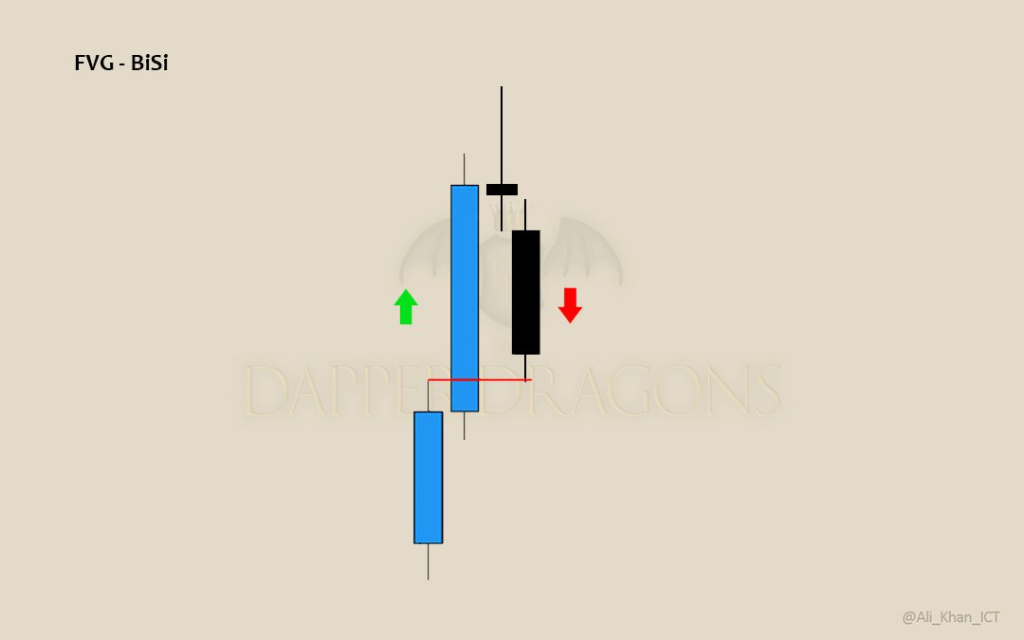
1. BISI (Buy-side Imbalance, Sell-side Inefficiency):
- Occurs when there is an aggressive rally in the market, leaving little or no opportunity for sellers to engage.
- Appears as a one-sided price movement, creating a gap or imbalance on the chart.
- Indicates a potential retracement area where unfilled sell orders may get fulfilled.
2. Visual Representation:
On a candlestick chart, BISI is represented by a sequence of bullish candles with minimal overlap between their lows and highs.
3. Why Do SIBI and BISI Occur in ICT?
1. Institutional Activity:
Large institutional trades create these imbalances as they aggressively buy or sell, causing price to move quickly in one direction.
2. Liquidity Voids:
Imbalances occur where liquidity is sparse, resulting in price skipping certain levels.
3. Market Sentiment:
Strong trends or news events amplify imbalances, as one side (buy or sell) dominates.
4. How to Identify SIBI and BISI on Charts in ICT
1. SIBI Identification:
Look for consecutive bearish candles with minimal wicks on the upper side.
There’s little overlap between the high of one candle and the low of the next.
Example:
A sharp downtrend in EUR/USD shows three consecutive bearish candles with no upward retracement.
2. BISI Identification:
Look for consecutive bullish candles with minimal wicks on the lower side.
There’s little overlap between the low of one candle and the high of the next.
Example:
A sharp uptrend in GBP/USD shows multiple bullish candles with no downward retracement.
5. Using SIBI and BISI in Trading in ICT
1. Trading Retracements to Imbalances
Imbalances often act as magnets for price. After a sharp move (SIBI or BISI), price retraces to fill the inefficiency.
Entry Point: Look for order blocks or fair value gaps within the imbalance.
Example:
In a bearish market, price forms a SIBI at 1.2000–1.1950. After the sell-off, price retraces to 1.1980 (midpoint of SIBI) before resuming the downtrend.
2. Combining with Killzones
SIBI and BISI are more effective when aligned with ICT killzones (e.g., London Open or New York Open).
Example:
During the New York session, a BISI forms in NASDAQ futures.
Price retraces to fill part of the imbalance during the killzone, providing an entry point for a continuation trade.
3. High Probability Trade Setups
SIBI or BISI near key liquidity zones or institutional levels increases the likelihood of a successful trade.
Example:
A SIBI aligns with a previous swing low in GBP/USD.
Price retraces to the imbalance midpoint before continuing downward.
6. Examples of SIBI and BISI in Action in ICT
Example 1: SIBI in EUR/USD
Scenario:
- EUR/USD drops sharply from 1.1200 to 1.1150, forming three consecutive bearish candles.
- No significant retracement occurs, leaving a clear SIBI.
Setup:
- Price retraces to 1.1175 (midpoint of the SIBI) before continuing the downtrend.
Example 2: BISI in GBP/JPY
Scenario:
- GBP/JPY rallies sharply from 155.50 to 156.50 during the London session.
- Multiple bullish candles create a BISI.
Setup:
- Price retraces to 156.00 (midpoint of the BISI) before resuming the uptrend.
7. How to Trade SIBI and BISI with ICT Tools
- Combine with Order Blocks:
- Identify order blocks within the imbalance for precise entry points.
- Use ICT Fibonacci Levels:
- Measure the imbalance range using Fibonacci. The 50% level often acts as a key retracement point.
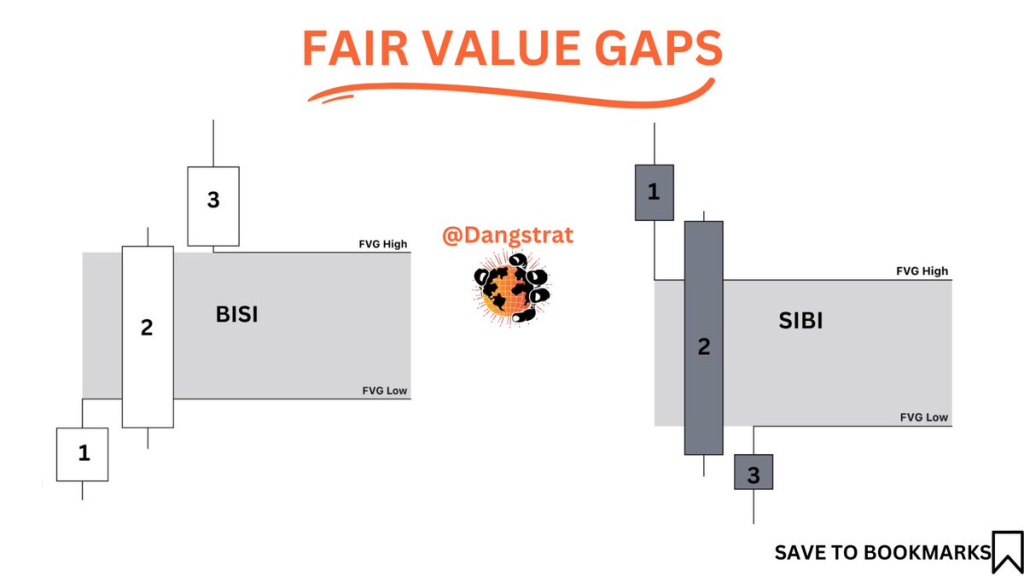
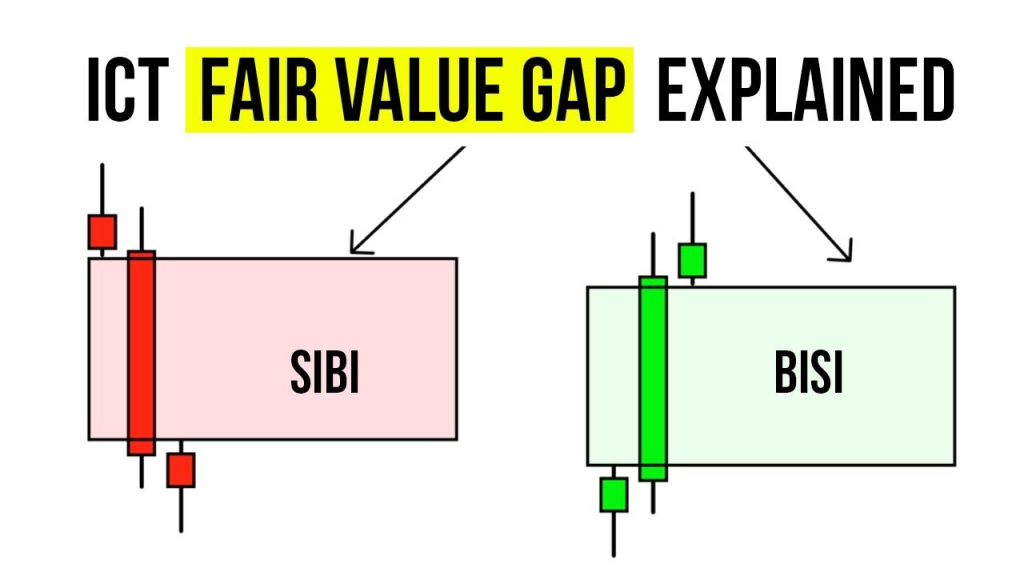
- Align with Fair Value Gaps (FVGs):
- SIBI or BISI frequently overlaps with FVGs, adding confluence to the setup.
- Risk Management:
- Place stop-losses just beyond the imbalance zone or the order block.
- Target the next liquidity pool or structural level.
8. Tips for Successful Trading of SIBI and BISI in ICT
- Patience is Key: Wait for price to retrace into the imbalance zone rather than chasing the move.
- Focus on Higher Timeframes: SIBI and BISI on higher timeframes (e.g., 4H, Daily) are more reliable.
- Combine Multiple ICT Concepts: Align SIBI/BISI with other tools like liquidity sweeps, killzones, and market structure.
9. Final Thoughts
SIBI and BISI are essential concepts in ICT trading, helping traders identify price inefficiencies created by institutional moves.
By understanding and applying these imbalances in conjunction with other ICT tools, traders can improve their trade precision and profitability.
Practice these concepts on historical data to gain confidence before using them in live trading.
Leave a Reply