
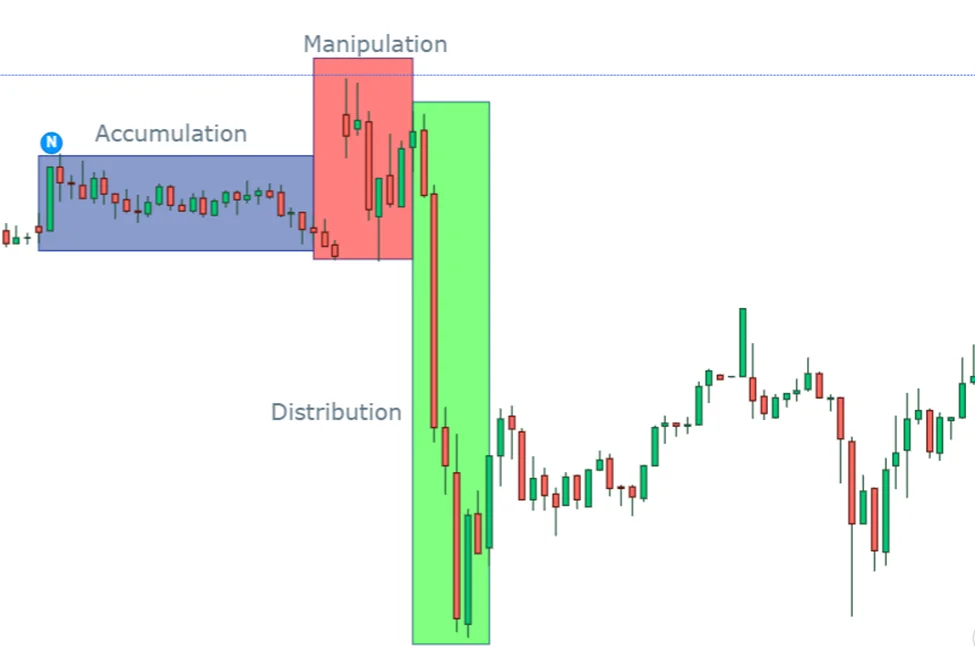
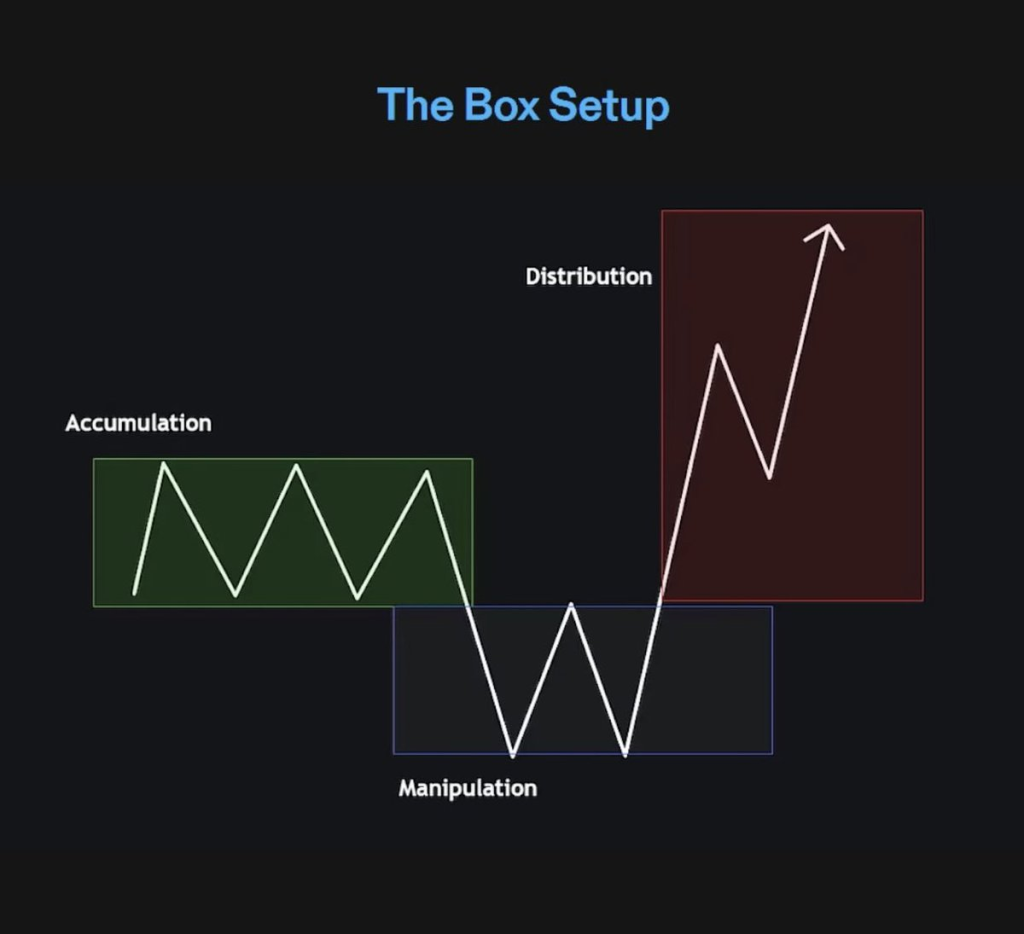
Institutional accumulation and distribution phases are key concepts in ICT (Inner Circle Trader) methodologies, where institutional traders or “smart money” accumulate or distribute large positions over time without significantly impacting price.
Recognizing these phases can help traders identify high-probability setups as institutions prepare to make significant moves in the market.
Let’s break down both phases in detail with examples, focusing on how ICT concepts help in identifying these institutional footprints.
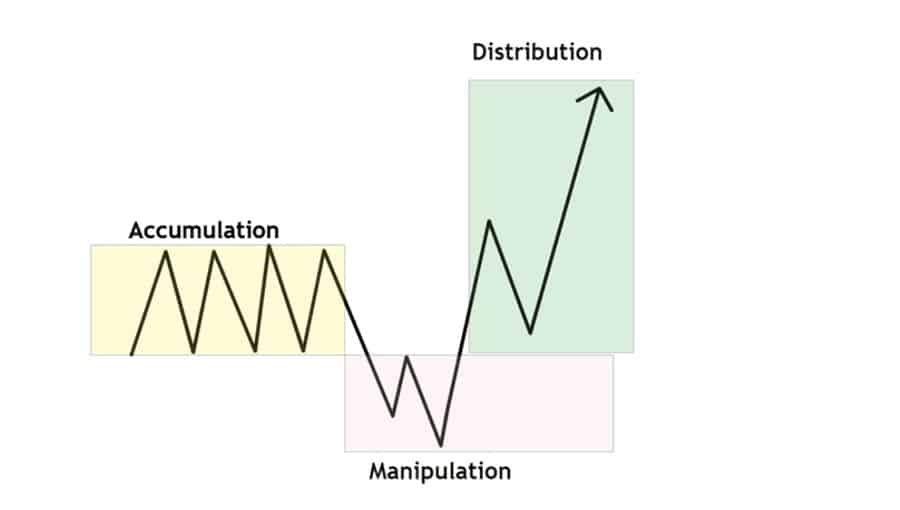
1. Accumulation Phase in ICT
Accumulation occurs when institutions (smart money) are buying large amounts of an asset without significantly moving the market upwards.
They often accumulate at low prices after a downtrend, preparing for a bullish move.
Retail traders typically don’t notice this phase as the price is usually moving in a range or sideways.
1. Characteristics of the Accumulation Phase:
1. Tight Price Range:
The price moves sideways or within a narrow range, with low volatility.
2. Repeated Test of Lows:
The price might test a previous support or liquidity pool multiple times, shaking out retail traders’ stop losses.
3. Liquidity Sweeps:
Institutions may create false breakouts below the range to trigger retail stop-losses and buy at lower prices.
2. How to Recognize Accumulation with ICT Concepts:
1. Order Blocks:
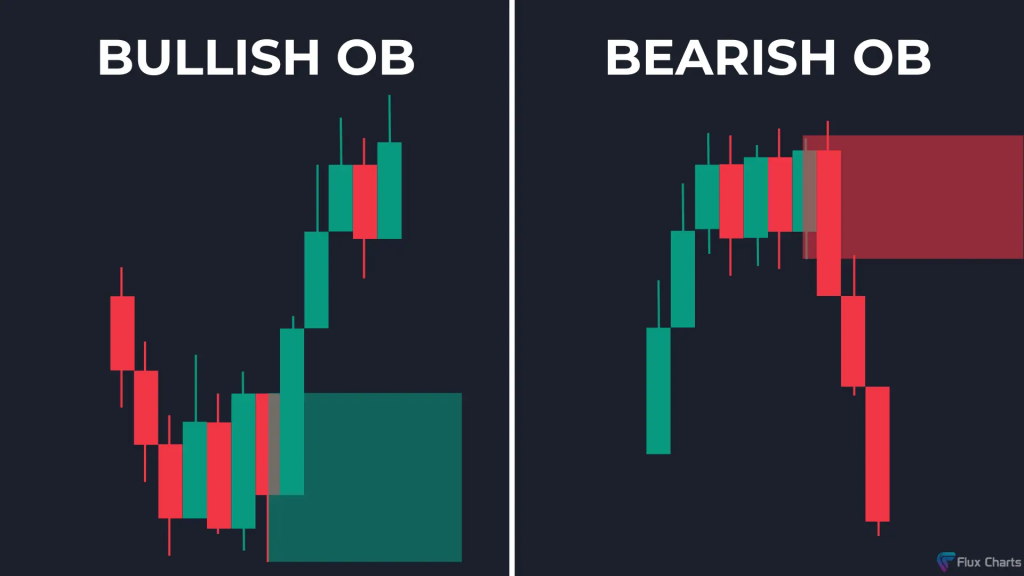
Look for a bullish order block in the accumulation zone.
An order block forms when institutions place large buy orders at a specific price level.
In an accumulation phase, price often dips into an order block before moving higher.
2. Liquidity Grabs:
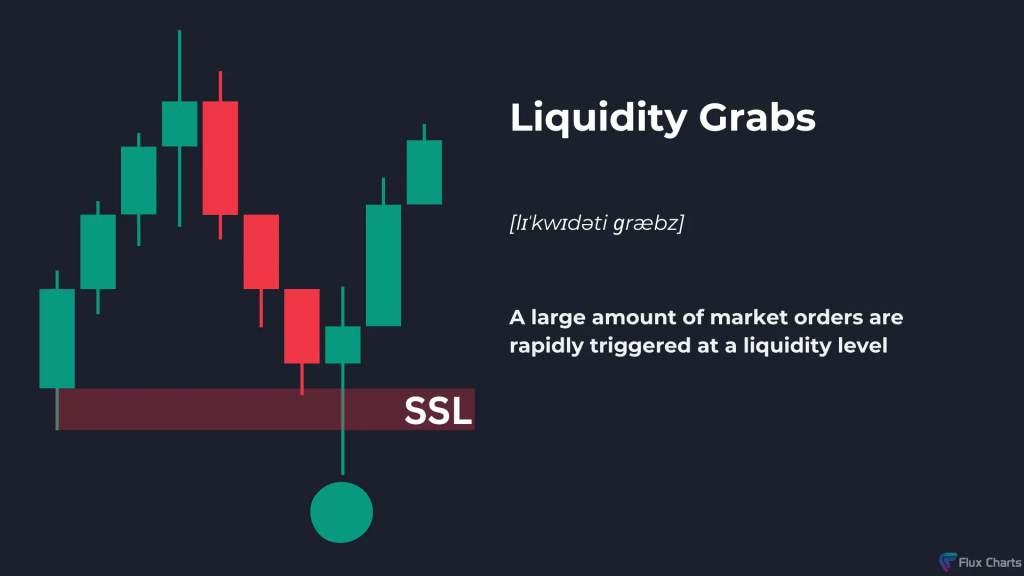
Institutions may push the price lower briefly, below significant swing lows, to sweep liquidity before moving upward.
This is known as a liquidity grab, where they stop out retail traders, accumulate more, and reverse the price upward.
3. Fair Value Gaps (FVGs):

An FVG can often appear after a strong down move during the accumulation phase, indicating that price has moved too far too fast.
Institutions may push the price back into these imbalances to fill the FVG and continue accumulating.
3. Example of an Accumulation Phase:
Imagine the EUR/USD pair has been in a downtrend, reaching a significant low at 1.1000.
Over the next few weeks, the price moves sideways between 1.1000 and 1.1100, testing the support level at 1.1000 multiple times but failing to break lower. During this time, you notice:
- A bullish order block formed at 1.1000. Each time the price touches this level, it rebounds slightly, showing that institutions are buying.
- A liquidity grab occurs when price briefly dips below 1.1000, triggering retail stop-losses, but quickly reverses back into the range. This false breakout signals smart money is accumulating.
- Volume may also slightly increase during this phase, signaling institutional interest.
Once institutions have accumulated enough positions, the price breaks out of the range and starts a new uptrend.
2. Distribution Phase in ICT
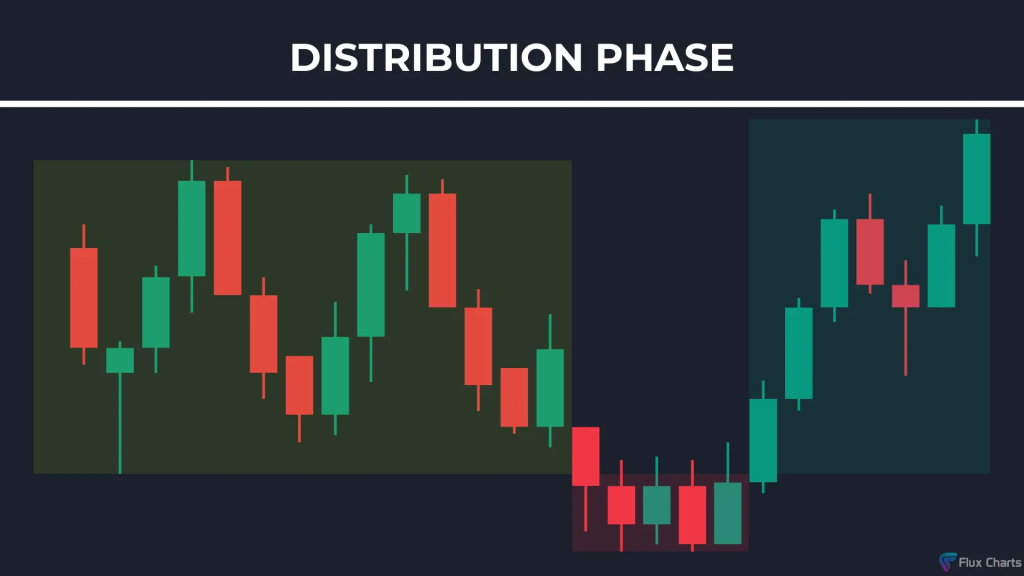
Distribution happens when institutions (smart money) are selling their accumulated positions at higher prices after an uptrend.
They distribute their holdings slowly without causing a sharp drop in price, often leading to a sideways market that later breaks downward.
1. Characteristics of the Distribution Phase:
1. Sideways or Range-bound Movement:
The price typically moves sideways or within a tight range, showing little upside momentum.
2. Repeated Test of Highs:
The price might repeatedly test a resistance level or swing high, triggering buy stops above the range before reversing.
3. Liquidity Grabs:
Institutions push the price above the resistance level (a false breakout) to trigger retail traders’ buy orders, only to reverse the price and distribute their positions at higher prices.
2. How to Recognize Distribution with ICT Concepts:
1. Bearish Order Blocks:
During distribution, a bearish order block may form near the top of the range.
Each time the price touches this level, it faces resistance and reverses, indicating that institutions are distributing their positions.
2. Break of Structure (BOS):

A Break of Structure to the downside signals that the market structure has shifted from bullish to bearish.
When the price breaks below key lows or support levels, it confirms that distribution is ending and the downtrend is about to begin.
3. Fair Value Gaps:
After a strong up move, price may leave behind a Fair Value Gap (imbalance), which institutions use to distribute positions.
Once the price revisits the FVG, institutions might sell heavily, leading to a price drop.
3. Example of a Distribution Phase:
Consider the GBP/USD pair has been in an uptrend, reaching a key resistance level at 1.3000.
The price starts moving sideways between 1.2950 and 1.3050, forming a distribution range. You observe the following:
- A bearish order block forms at 1.3050. Each time the price reaches this level, it faces selling pressure and moves lower.
- A liquidity grab occurs when the price briefly spikes above 1.3050, triggering retail buy orders. However, the price quickly reverses, trapping retail traders in losing positions.
- A Break of Structure happens when the price breaks below 1.2950, signaling the end of distribution and the beginning of a downtrend.
Once institutions have fully distributed their positions, the price breaks below the range and begins a new downtrend.
3. ICT Concepts to Enhance Recognition of Institutional Phases
1. Institutional Order Flow:
ICT focuses heavily on following institutional order flow. Understanding where smart money is accumulating or distributing positions allows you to trade in the direction of the bigger players, significantly improving your success rate.
2. Order Blocks:
These are areas where institutions have placed significant buy or sell orders.
In the accumulation phase, look for bullish order blocks at the bottom of ranges. In the distribution phase, identify bearish order blocks at the top of ranges.
3. Liquidity Pools:
In both phases, institutions target liquidity pools (clusters of stop-losses or pending orders) to manipulate price in their favor.
Recognizing where these pools are can help you spot false breakouts and avoid being trapped by the market.
4. Market Structure Shifts:
A key ICT concept, market structure shifts occur when the market transitions from accumulation to an uptrend or from distribution to a downtrend.
Monitoring these shifts helps traders enter and exit at the right time.
5. Fair Value Gaps (FVGs):
When institutions move price aggressively, they create imbalances in the market.
These gaps can be filled later during the accumulation or distribution phases, offering opportunities for smart money to accumulate or distribute.
4. Conclusion
By using ICT concepts, traders can recognize accumulation and distribution phases with greater precision, aligning their trades with institutional strategies.
These phases reveal where institutions are positioning themselves before major market moves, allowing retail traders to ride along with the big players.
Whether through identifying order blocks, recognizing liquidity grabs, or tracking market structure shifts, understanding these phases offers a powerful edge in the market.
Properly timing entries and exits around these phases can result in high-probability trades with excellent risk-to-reward ratios.
Leave a Reply