
In Inner Circle Trader (ICT) strategies, market structure forms the foundation for understanding price action and making informed trading decisions.
It involves recognizing the pattern of higher highs, higher lows, lower highs, and lower lows that define the direction and strength of a market’s trend.
Understanding market structure allows traders to anticipate shifts in trend, identify high-probability trade setups, and avoid common retail traps.
Let’s explore how ICT defines market structure, with detailed explanations and examples.
1. Highs and Lows in Market Structure in ICT

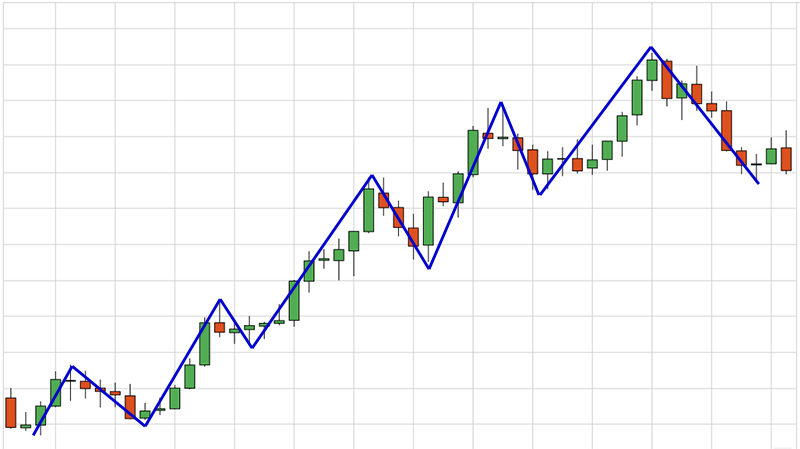
Market structure revolves around the consistent formation of swing highs and swing lows in price action. These points are critical because they reveal the market’s intent—whether it’s trending upward, downward, or consolidating.
- A swing high is a peak in the market where the price temporarily reverses direction from up to down.
- A swing low is a trough where the price reverses from down to up.
These highs and lows help define whether the market is trending or not, and identifying them accurately is crucial in ICT trading.
Example:
Suppose you’re looking at a chart of the EUR/USD currency pair.
- If price is forming a series of higher highs and higher lows, this indicates an uptrend. Each new high is higher than the previous high, and each low is higher than the previous low.
- Conversely, if the market is making lower highs and lower lows, this suggests a downtrend.
Traders use this information to determine when to enter trades—buying during an uptrend and selling during a downtrend.
2. Uptrend: Higher Highs and Higher Lows in ICT

An uptrend is characterized by the market making higher highs and higher lows.
In ICT, this is a clear sign that smart money (institutional traders) is accumulating long positions, pushing the market higher.
- Higher highs indicate that buyers are in control, consistently pushing the price to new peaks.
- Higher lows suggest that even during pullbacks, the market is maintaining strength, as sellers fail to push the price below the previous low.
Example:
Imagine Apple stock (AAPL) is in an uptrend. The price rallies from $150 to $160, then pulls back to $155 before rising to $165.
This series of higher highs ($160, $165) and higher lows ($155) tells an ICT trader that institutions are buying on the pullbacks, and the trend is likely to continue upward.
In this scenario, an ICT trader would wait for the price to pull back to a key order block or a fair value gap (FVG), looking for a long entry near the higher low. The goal is to join the smart money and ride the trend upward.
3. Downtrend: Lower Highs and Lower Lows in ICT

A downtrend is characterized by the market forming lower highs and lower lows, signaling that institutions are offloading positions or entering short trades.
- Lower highs occur when each rally fails to reach the previous peak, suggesting weakening demand.
- Lower lows indicate that selling pressure is increasing, as the market consistently moves to new lows.
Example:
Consider the GBP/USD currency pair in a downtrend. The price falls from 1.3200 to 1.3100, rallies to 1.3150, and then drops further to 1.3050.
The series of lower highs (1.3150) and lower lows (1.3050) confirms a bearish market structure, indicating that institutional traders are likely pushing the market lower.
In this case, an ICT trader would look to enter a short position near the lower high, potentially identifying an order block or liquidity grab as an entry point.
4. Market Structure Shifts in ICT

A market structure shift (MSS) occurs when the price breaks out of its current trend, signaling a potential trend reversal.
ICT traders use this shift as a signal that smart money is transitioning from buying to selling (or vice versa), and the market is likely to change direction.
The key to identifying a market structure shift is recognizing when the price fails to maintain its previous pattern of highs and lows.
For example, in an uptrend, a break below a significant swing low signals that the trend may be reversing into a downtrend.
Example:
Let’s say Bitcoin has been in a strong uptrend, forming higher highs and higher lows.
The price reaches a high of $40,000, then pulls back to $38,000 before rising to $42,000.
However, instead of making a new high, the price suddenly breaks below $38,000, a market structure shift signaling a potential reversal.
An ICT trader would now start looking for opportunities to enter short positions, anticipating that smart money is offloading long positions and driving the price lower.
5. Consolidation: Ranges and Sideways Markets in ICT

When the market fails to make consistent higher highs or lower lows, it often enters a period of consolidation, trading in a sideways range.
During consolidation, the market moves between established support and resistance levels, with neither buyers nor sellers in clear control.
In ICT strategies, consolidations are crucial because they often precede significant breakouts, which offer trading opportunities.
During consolidation, smart money is typically accumulating or distributing positions, preparing for the next move.
Example:
Imagine the S&P 500 is trading in a range between 4400 and 4500 for several weeks.
Each time the price reaches the lower boundary (4400), it bounces higher, and every time it reaches the upper boundary (4500), it pulls back.
ICT traders know that this consolidation could lead to a liquidity grab at one of the boundaries.
An ICT trader would look for liquidity pools near these boundaries and prepare to enter trades after a stop hunt—for instance, buying after a stop hunt below 4400, expecting a breakout to the upside.
6. ICT Market Structure Example: EUR/USD
Let’s take a detailed example using the EUR/USD currency pair.
1. Uptrend (Higher Highs and Higher Lows):
The price rises from 1.2000 to 1.2100 (higher high), then retraces to 1.2050 (higher low), and pushes up to 1.2200 (higher high).
During this uptrend, an ICT trader would look for bullish order blocks around 1.2050 to enter long positions, in line with smart money.
2. Downtrend (Lower Highs and Lower Lows):
After hitting a peak of 1.2200, the price falls to 1.2150 (lower low), rallies to 1.2175 (lower high), and then drops to 1.2100 (lower low).
The market is now in a downtrend, and an ICT trader would look for bearish order blocks around 1.2175 to enter short positions, expecting the market to continue downward.
3. Market Structure Shift:
If the price breaks above 1.2175, it signals a market structure shift and a potential reversal back into an uptrend.
The ICT trader would start looking for long setups, anticipating that smart money is accumulating again.
7. Combining Market Structure with ICT Concepts
ICT traders don’t rely on market structure alone—they combine it with other ICT concepts like liquidity grabs, order blocks, and fair value gaps to refine their entries and exits.
Example of Combining Concepts:
Let’s say GBP/USD is in a downtrend, forming lower highs and lower lows.
However, just before making a new lower low, the price spikes higher, grabbing liquidity above the previous swing high.
ICT traders would recognize this as a stop hunt—institutions grabbing liquidity before driving the price lower.
The trader would enter a short trade after the liquidity grab, anticipating a continuation of the downtrend.
Conclusion
Understanding market structure is essential in ICT strategies, as it provides the foundation for interpreting price action and anticipating the next market move.
By identifying higher highs, higher lows, lower highs, and lower lows, traders can align their trades with institutional activity, making higher-probability trades.
Combining market structure with ICT concepts like order blocks, liquidity pools, and market structure shifts allows traders to stay one step ahead of the market, trading like the smart money.
Leave a Reply