
In Inner Circle Trader (ICT) strategies, reading price action without indicators is a critical skill that allows traders to analyze the market purely based on price movement, without the distraction or lagging nature of traditional indicators.
ICT emphasizes understanding how smart money (institutional traders) manipulates the market and how price moves in reaction to supply, demand, and liquidity grabs.
By focusing on price structure, key levels, and candlestick formations, traders can make more informed decisions and capture high-probability setups.
Here’s a detailed breakdown of how to read price action without using indicators, using ICT principles and examples to illustrate each point.
1. Understanding Market Structure (Price Action Foundation) in ICT
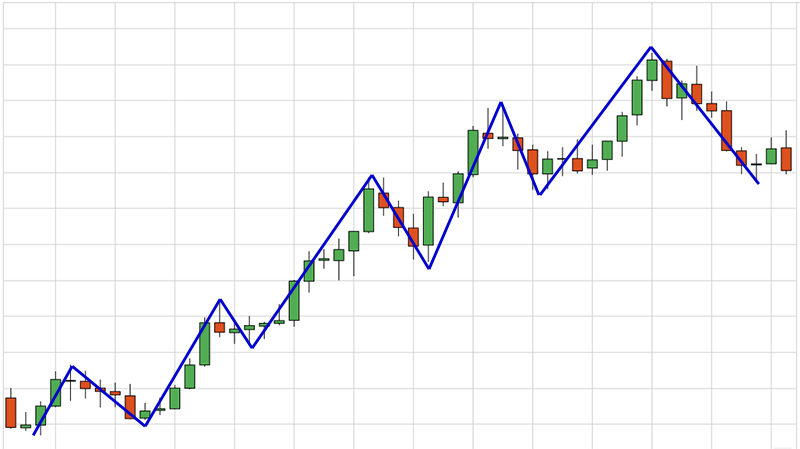
At the core of reading price action is the understanding of market structure.
Price moves in trends—either uptrending (higher highs and higher lows), downtrending (lower highs and lower lows), or consolidating (sideways range).
Market structure helps traders determine whether they should be looking for buy or sell opportunities, depending on the trend.
- Uptrend: Price creates higher highs (HH) and higher lows (HL).
- Downtrend: Price creates lower highs (LH) and lower lows (LL).
- Consolidation: Price moves within a defined range, failing to break higher or lower.
Example:
If the EUR/USD is creating higher highs and higher lows, an ICT trader recognizes the uptrend and looks for buying opportunities at higher lows. Conversely, in a downtrend, with lower highs and lower lows, the trader would seek to short the market at the lower highs.
2. Identifying Liquidity Pools in ICT
One of the most important aspects of ICT is understanding that smart money hunts for liquidity.
Liquidity pools form at areas where retail traders place their stop losses or pending orders.
These areas often include swing highs, swing lows, and round numbers.
Institutional traders will often manipulate price to these levels to create liquidity, allowing them to fill their large positions.
- Above swing highs: Stop losses from traders who are short.
- Below swing lows: Stop losses from traders who are long.
An ICT trader reads price action by identifying where liquidity pools exist and anticipating that price will move towards those areas before reversing.
Example:
Suppose the S&P 500 is in an uptrend and has just formed a swing high at 4500. Retail traders who went short will likely place their stop losses just above this level.
ICT traders would anticipate that institutions will drive price above 4500 to grab liquidity before the market reverses and continues lower.
3. Order Blocks and Institutional Zones in ICT
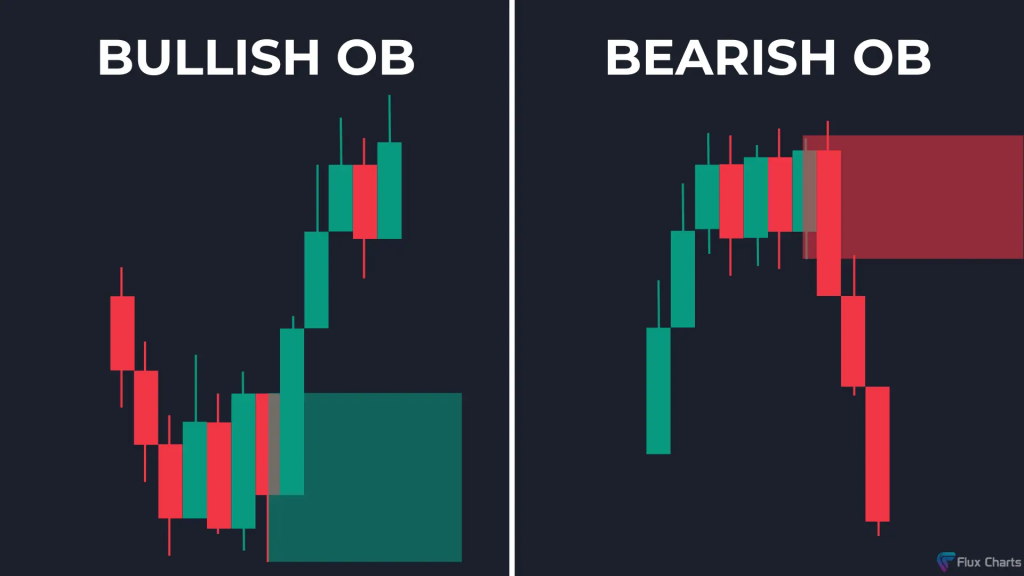
An order block is a price zone where smart money has entered large buy or sell orders, often visible through large, unfilled candles or key support and resistance zones.
These areas indicate where institutions have placed trades, and price often returns to these levels for liquidity before continuing the original trend.
ICT traders read price action by identifying these order blocks and anticipating that price will respect these areas.
If the market returns to an order block and holds, this could be a good entry point for a trade.
- Bullish Order Block: A zone where institutions placed buy orders.
- Bearish Order Block: A zone where institutions placed sell orders.
Example:
Let’s say Bitcoin is in an uptrend.
Price rallies from $30,000 to $35,000, then pulls back to an order block near $32,500.
An ICT trader recognizes this as an area where institutions likely placed buy orders and looks for a long entry, expecting price to rally from this zone.
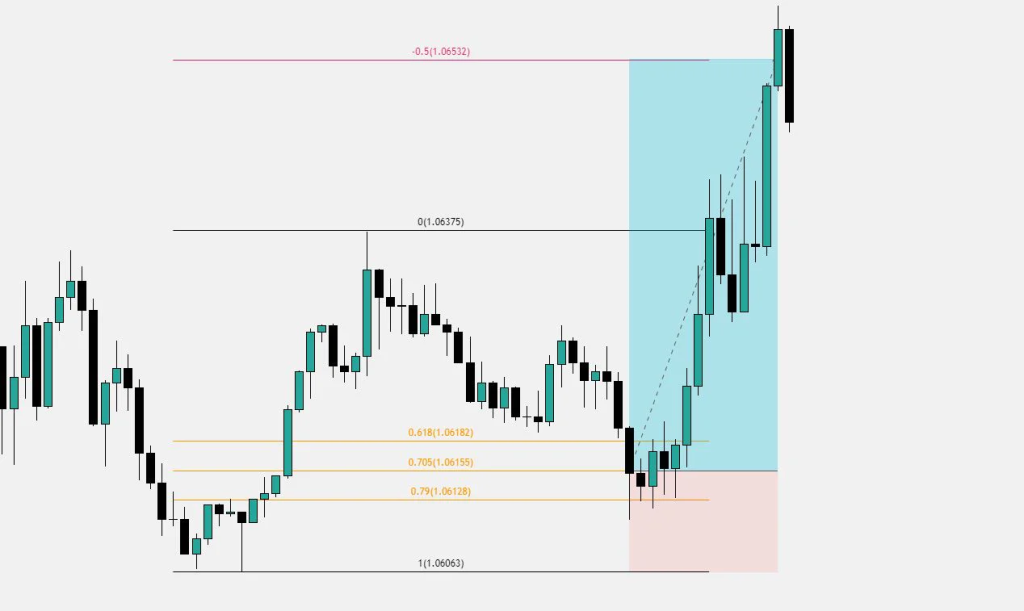
4. Fair Value Gaps (FVGs) in ICT
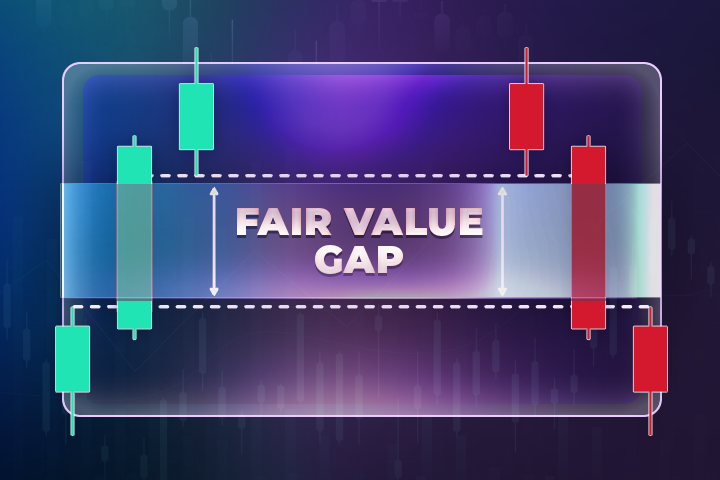
A Fair Value Gap (FVG) is a gap in price action where the market has moved too quickly in one direction, leaving an imbalance between buyers and sellers.
Price tends to revisit these gaps to rebalance the market before continuing in the original direction.
In ICT, these gaps are prime areas for price to retrace to, allowing traders to enter trades in line with the trend.
- Bullish FVG: A gap left when price moves rapidly upward, typically between two bullish candles.
- Bearish FVG: A gap left when price moves rapidly downward, typically between two bearish candles.
Example:
Assume Crude Oil spikes from $70 to $75, leaving a fair value gap between $71.50 and $72.50.
ICT traders anticipate that the price will pull back to this gap before continuing its upward trend.
They would look for long entries around the FVG zone for a better risk-reward setup.
5. Time and Price Theory (Killzones) in ICT
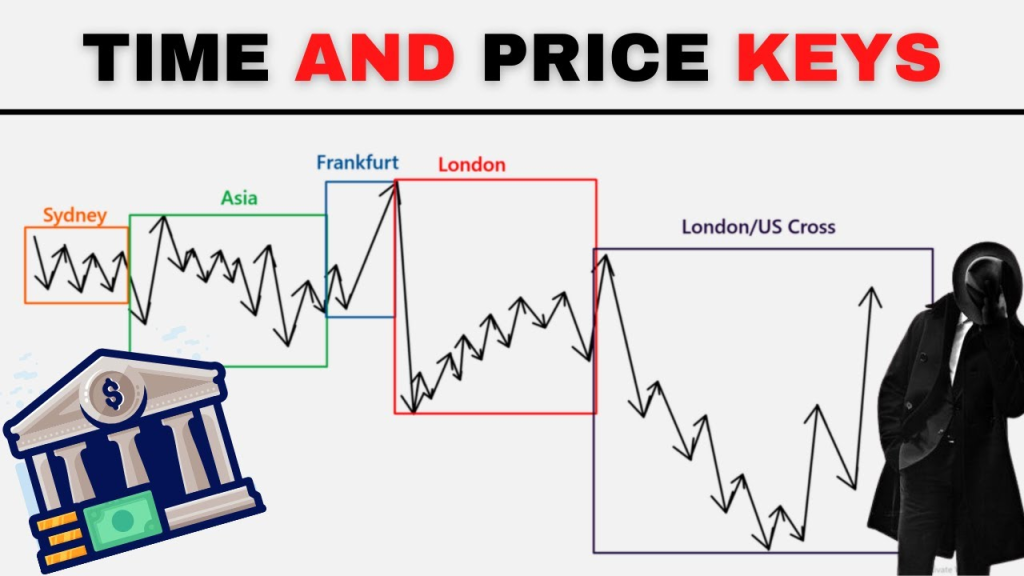
ICT places heavy emphasis on time and price theory, which asserts that price action follows specific patterns at key times of the day.
These times, known as killzones, are periods when institutions are most active, such as the London Open, New York Open, or London Close.
By observing how price moves during these killzones, traders can gain insight into institutional activity.
For example, sudden spikes in price during these periods often indicate liquidity grabs or stop hunts, where institutions are positioning themselves for larger moves.
Example:
Suppose the London Open happens at 3:00 AM EST, and you notice that the EUR/USD often makes a sharp move right at this time.
ICT traders expect price to make a stop hunt during this period, grabbing liquidity before the true trend begins.
If the price spikes lower during the London Open, an ICT trader would look for a bullish setup to go long, anticipating the real move upward to follow.
6. Candlestick Patterns (Institutional Candles) in ICT

Candlestick patterns are one of the most basic ways to read price action, but ICT traders focus on specific institutional candles that signal smart money involvement.
Some of the key patterns ICT traders watch for include engulfing candles, imbalance candles, and pin bars.
These patterns can reveal institutional accumulation or distribution.
- Engulfing candle: A large candle that engulfs the previous candle, signaling a shift in momentum.
- Imbalance candle: A candle with little to no wick on one side, indicating strong institutional buying or selling.
- Pin bar: A candle with a long wick and small body, indicating a liquidity grab before reversing direction.
Example:
Consider a bullish engulfing candle on the NASDAQ index.
Price has been drifting lower but suddenly forms a large bullish candle that engulfs the previous bearish candle.
ICT traders recognize this as a potential signal that institutions are buying the market and will look for long opportunities on the next retracement.
7. Market Structure Shifts (MSS) in ICT
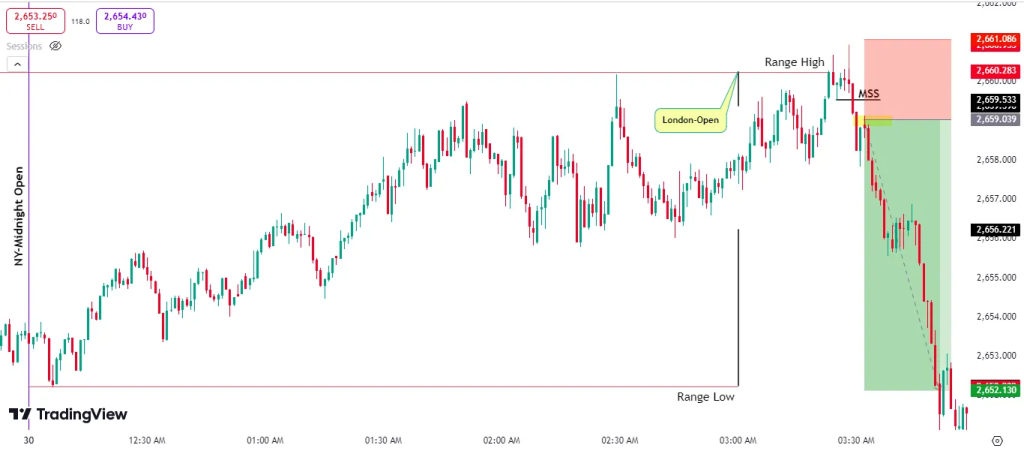
A Market Structure Shift (MSS) occurs when the price breaks out of its existing trend and signals a potential reversal.
ICT traders use MSS to identify when the market is shifting from bullish to bearish or vice versa.
Price will often make a clear break of a previous high or low, confirming that the current trend is losing strength and a new trend is beginning.
Example:
Imagine Gold is in a downtrend, creating lower highs and lower lows. Suddenly, price breaks above a key lower high, signaling a market structure shift.
ICT traders now anticipate a reversal into an uptrend and look for buying opportunities on the next pullback.
8. Liquidity Raids and Stop Hunts in ICT

ICT traders pay close attention to liquidity raids or stop hunts, where institutions intentionally push the price to grab liquidity before reversing it.
These moves often occur around key levels such as swing highs and lows, where retail traders place their stop losses.
After grabbing liquidity, price typically reverses, giving traders a high-probability entry point.
Example:
Suppose GBP/USD is trading near a swing high at 1.3600. Many retail traders have placed stop losses above this level, expecting the price to stay below it.
ICT traders anticipate that institutions will push the price above 1.3600 to grab liquidity before reversing it lower.
After the stop hunt, an ICT trader would enter a short position, expecting a drop in price.
9. Patience and Precision in ICT

ICT strategies emphasize patience—waiting for price to reach key levels and exhibit signs of institutional activity before entering trades.
The idea is to trade with precision, entering trades at optimal points such as order blocks, liquidity pools, or during killzones, where the market is most likely to reverse or make its true move.
Conclusion
Reading price action without indicators, based on ICT principles, requires traders to focus on market structure, liquidity pools, order blocks, and institutional candles.
By observing how price behaves around these areas, traders can anticipate where the market is likely to move next, aligning themselves with smart money.
Understanding how institutions operate allows traders to catch high-probability setups and trade with greater confidence, without the need for traditional indicators.
Leave a Reply